Crude oil prices end 2017 at highest levels since 2013
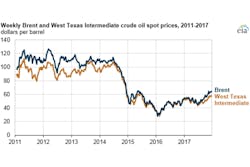
And the end of 2017, crude oil prices were at $60/barrel (b). West Texas Intermediate (WTI) crude oil prices were up $6/b from the end of 2016 at $51/b, while Brent prices were up $10/b since the end of 2016. The U.S. Energy Information Administration (EIA) noted that prices increased in spite of relatively high U.S. crude oil production because of Organization of the Petroleum Exporting Countries (OPEC) production curtailments. The 2017 OPEC agreement limit production tightened supplies and put upward pressure on prices.
US fossil fuel production could set records in 2018 and 2019
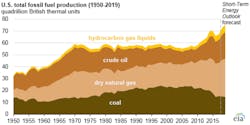
The EIA expects the U.S. to produce an average of nearly 73 quadrillion British thermal units (Btu) in 2018, the highest on record. The agency forecasts that number to rise to 75 quadrillion Btu in 2019.
The record-setting levels will largely be caused by greater natural gas and crude oil production, which is enabled by hydraulic fracturing techniques in tight rock formations. Natural gas production will likely be the major contributor to production growth in 2018, which crude oil production growth will lead increases in 2019. In its Short-Term Energy Outlook, the EIA reported that natural gas will serve as the main source of U.S. electricity generation for at least the next two years.
Based on heat content, dry natural gas made up the largest share of fossil fuel production in 2017 at 41 percent, followed by crude oil and 29 percent, coal at 23 percent and hydrocarbon gas liquids at 7 percent.
2017 ends with higher US gas prices
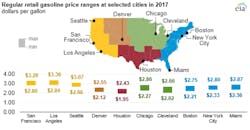
The price of a gallon of regular gasoline averaged $2.41 at the end of 2017, said the EIA, 27 cents (13 percent) higher than in 2016, but two cents less than in 2015. Higher crude oil prices were a contributor. Every U.S. city except Houston, Texas, saw prices rise above $2.50 per gallon at some point during 2017. Events such as Hurricane Harvey in the Gulf Coast and on the East Coast also affected prices.
Retiring power plants mainly run by fossil fuels
A large majority of the utility-scale power plants that were retired in the U.S. from 2008 through 2017 were powered by fossil fuels, reported the EIA. Coal power plants represented 47 percent, while natural gas steam turbines accounted for 26 percent. The types of plants will account for most of the planned retirements of power plants through 2020. Factors that influenced the decisions to retire these plants include the plants’ ages (52 years on average), regional electricity use, federal or state policies and improving technologies.
EIA: Crude oil prices flat, global production rises through 2019
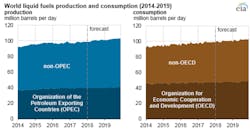
In its Short-Term Energy Outlook, the EIA predicts average Brent crude oil prices to rise from $54/b in 2017 to $60/b in 2018 and $61/b in 2019. The agency also expects global production to be higher than global consumption, with U.S. production increasing more than other countries. It is forecast to rise to an average of 10.3 million barrels per day (b/d) in 2018, the highest annual average production in U.S. history. By 2019, the EIA expects levels to increase to an average of 10.8 million b/d.
Relatively flat crude oil prices should contribute to steady gasoline prices. The average 2017 price was $2.42/gallon (gal). The EIA expects that price to increase to $2.57/gal in 2018 and $2.58/gal in 2019.
In 2017, petroleum and other liquid fuels consumption grew globally to an average of 98.4 for the year, up by 1.4 million b/d. Consumption is expected to grow to an average of 1.7 b/d in 2018 and 1/6 b/d in 2019.
Natural gas numbers increase from 2016 to 2017, to remain flat in 2018 and 2019
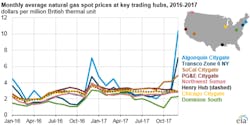
While higher Henry Hub natural gas prices contributed to less natural gas consumption for power generation, natural gas prices at key regional trading hubs were less volatile in 2017 than in previous years, noted the EIA.
Contributors to 2017 prices included warmer weather and pipeline activity in the Northeast, balanced by record cold temperatures in the Eastern U.S. in December. Despite an increase in natural gas-fired capacity additions in 2017, higher natural gas prices led to a 6 percent year-over-year decline in natural gas consumption for power generation as coal become more competitive. Another factor to prices were mild winter temperatures in early 2017, which limited natural gas storage withdrawals.
U.S. liquefied natural gas (LNG) exports grew 1.4 billion cubic feet per day (Bcf/d) to 1.9 Bcf/d in 2017. If all currently planned liquefication facilities are completed, U.S. liquefication capacity will reach 9.6 Bcf/d, the third largest behind Qatar and Australia.
The EIA expects natural gas production to increase while consumption remains relatively flat, which it says will lead to an average Henry Hub spot price of $2.88 per million British thermal units (MMBtu) in 2018 and $2.92/MMBtu in 2019.
Crude oil and petroleum prices spur higher energy commodity costs
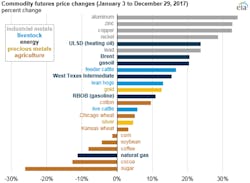
The spot energy index in the Standard and Poor’s (S&P) Goldman Sachs Commodity Index (GSCI) was 16 percent higher at the end of 2017 than it was in the beginning of the year, according to the EIA. The index fell nearly 20 percent in the first half of 2017, but increases in crude oil and petroleum product prices in the second of the year helped the index rebound.
The energy index usually follows major crude oil price movements because the WTI and Brent account for 70 percent of the weighing in the index.
Appalachian Basin states natural gas production outpacing demand
Natural gas production in Ohio, Pennsylvania and West Virginia increased from a combined 1.4 Bcf/d in 2008 ot nearly 24 Bcf/d in 2017, reported the EIA. Together, these states accounted for 27 percent of total US natural gas production, up from 2 percent in 2008, based on data through October 2017. Natural gas consumption over the same period also grew, but to a lesser extent. Nearly all of the consumption growth in these states is attributed to the electric power sector. Before 2011, most natural gas production in the states came from the Gulf Coast and was lower than demand. Since then, however, greater supply has met the needs of these three states and those neighboring them. Pipelines have been modified to transport natural gas out of the region, and new pipelines will link the Appalachian supply to downstream markets.
