Editor’s Note: This is Part IV of a four-part series on the optimization of evaporative cooling towers. The first three parts of this series appeared in the June (pages 20-23), August (pages 18-19) and September (pages 20-23) issues of Flow Control. You can read all parts online at the links below.
Part III: How Air Flow Affects Evaporative Cooling Tower Efficiency
Part II: How Changes in Flowrate Affect Evaporative Cooling Tower Efficiency
Part I: How Heat Loads Affect Evaporative Cooling Tower Efficiency
Based on the previous parts in this article series, we know that reducing the pump and tower fan speed are two of the options we can choose for optimizing the efficiency of an evaporative cooling tower. The most important caveat when applying the Affinity Laws is that they assume no change in efficiency.
The Affinity Laws have a static head-ache
In the world of pumps, the word "head" typically is used to define the pressure difference to overcome the resistance the pump must produce to achieve a certain flow. Generally speaking, in evaporative cooling systems there are two kinds of head that add resistance to the pump. The first is friction head, which can be loosely defined as the amount of pressure drop the pump must overcome due to things like the pipe, strainers, nozzles, fittings and valves, or any item in the piping system that impedes the flow.
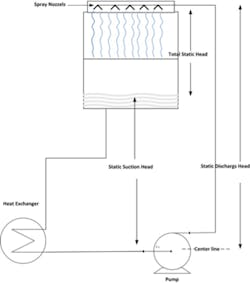
The second is static head, which is defined as the net positive pressure when the pump is off and the water is above the pump centerline. In closed towers, static head is usually not a concern since the positive lift on the discharge side is usually negated by the negative lift on the suction side based upon using the loosely based "what goes up must come down" law of physics. This is not the case in open evaporative cooling towers, as shown in Figure 1.
In Figure 1 the total static head is comprised of the difference between the point where the water discharges at the top of the tower and the upper water level in the basin. This means that before a single drop of water can flow, the pump must achieve a high enough speed to overcome this column of water. If, for example, the distance between the top of the tower and the water level at the top of the basin is 8 feet, then, simply put, the static head of the system would be 8 ft/wc, or roughly (8÷2.31) 3.46 PSI.
So here is the first issue, since the pump must first overcome the pressure being forced down on it due to gravity before any water can flow, it tends to throw the Affinity Laws out of the proverbial window. Remember, the Affinity Laws say that for every amount of change in pressure, there is a corresponding squared change in flow. With static head, as the pump begins to ramp up in speed, the pressure will be increasing, and yet there is zero flow until the static head is overcome.
Figure 1. Static pump head
The false curve vs. the real curve
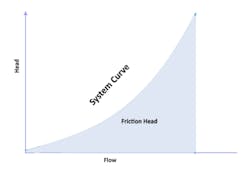
If we did not have to deal with static head, the pump performance curve would look similar to Figure 2. In this case, the entire performance of the pump can be calculated fairly closely by using the Affinity Laws, assuming the efficiency does not change considerably.
Figure 2. Friction head curve
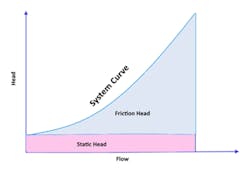
With static head in the equation, the actual pump curve would look more like Figure 3.
Figure 3. Total friction curve
As you can see, the actual flow does not begin until the static head is overcome. Once the static head is overcome, the Affinity Laws will once again become somewhat relevant. What also becomes obvious is that the amount of speed reduction that can possibly be achieved is restricted by the fact that you reach zero flow at the point where static pressure starts, which is always before the pump has reached zero speed.
Dealing with static head
The bad thing about static head is that it does throw off the Affinity Laws calculation. On the other hand, the nice thing about static head is that regardless of how much flow (or anything else for that matter) it remains constant. This means that if you subtract it from the total, as shown in the table below, the Affinity Laws can once again become somewhat relevant.
Efficiency change with static head
Because systems with static head do not follow the same curve patterns as those with friction only, the result is a greater decrease in efficiency as the pump speed is decreased. The greater percentage of static head that exists as compared to friction head, the greater the change in efficiency.
For purposes of a rough estimate, the Affinity Laws can give you an idea of how much savings potential there is if adding a variable speed drive; to calculate more precisely requires additional, and fairly complex, algorithms.
Nozzle pressure and full fill requirements
The second consideration has to do with the tower itself. Tower manufacturers normally provide specifications for the minimum flow requirements on their towers based on the minimum nozzle pressure required. Dependent on the type and quantities of nozzles, as well as the type of tower, the required pressure can vary significantly. Dependent on the nozzle sizes selected, the turndown ratio of the tower can vary significantly. As a general rule, the maximum acceptable turndown ratio is about 50 percent. Be cautious, however, as design engineers may occasionally select larger orifices to reduce pump head, which will change the turndown ratio. Lower than recommended water flow rates can not only impede the heat transfer efficiency of the tower, but can also lead to siphoning of the tower basin (sucking air into the system).
You should also be aware that running a tower in freezing conditions with lower water flows can make the tower more susceptible to freezing. In either case, it is always recommended to work with the tower manufacturer to ensure the water flows you are considering meet with the tower manufacturer’s minimum requirements.
Don’t forget about the heat exchanger
Heat exchangers in general have a minimum velocity restriction. Very much like the minimum flow restrictions on the tower, each heat exchanger has a minimum amount of flow it can tolerate for proper heat transfer. The minimum flow requirement of a typical process heat exchanger is a factor of when the water flow is no longer as turbulent as it needs to be to carry away the heat. With typical heat exchangers, if the inlet cooling tower temperature of the water is lowered in proportion to the flow, the approach should remain pretty much the same at full heat load until you reach the minimum flow requirements. Some facilities may have heat exchangers that were custom made where there is no longer any information or company to call to determine minimum flow requirements. In these cases, experimentation can be employed to determine where the minimum flow point is by monitoring the approach while varying the inlet water temperatures to the proper amounts. This should be done when the heat load is at maximum, as approach will be naturally lower as the heat load decreases. Obviously, care must be taken to not let the approach get too high.
As an example of determining what temperature tower supply water is needed to maintain the approach, let’s assume that our design conditions are 85 F tower entering and 95 F tower leaving with 100 GPM. At these conditions, the heat load would be (GPM X 500 X TD or 100 X 500 X 10) = 500,000 BTU/hr. To get the same amount of heat transfer with a 62.5 percent reduction in flow, the entering water temperature would need to be around (BTU/hr ÷ GPM x 500 = 500,000 ÷ 62.5 X 500 = 16. And since our leaving water temperature is still 95 F with the new temperature difference being 16 F, the new supply water temperature would be (95 – 16) = 79 dF. If the heat exchanger has 62.5 GPM with a 79 F tower entering water temperature, the tower water leaving the heat exchanger should still be around 95 degrees F, and the approach should still be around 10 F. If the approach increases, the heat exchanger is probably below its minimum flow requirements. Generally speaking, process heat loads change. Therefore, if controlling the pump speed is desired a control strategy that tracks the approach of the heat exchanger and adjusts the speed of the pump to maintain a constant approach may be a good option.
The last consideration is the type of heat load. Applications like refrigeration where lower tower water temperature and higher water flow reduces the energy consumption of the process (in this case a refrigeration compressor) are a bit more complicated. In this case, the maximum approach is the limit, whereas the sum of the power is the control point. In these cases, running a higher volume of water at a lower temperature can use less energy since the compressor runs with less power and the approach is allowed to reduce as much as needed. A word of caution is that certain kinds of compressors, such as centrifugal types, cannot tolerate too low of a pressure difference as a result of a low supply water temperature. Centrifugal compressors must always maintain a minimum refrigerant pressure difference that ensures the impeller will not turn backward (also known as a surge). If this happens, the compressor can be severely damaged. In centrifugal compressor applications, pressure sensors on each side of the compressor monitoring the refrigerant pressure difference should be included in the control strategy as a limit to the supply water temperature.
Tower fan, pump or both?
If the heat load is such that the process power is not improved by lower than design temperatures, controlling the tower fan speed seems less complicated because all that is required is to maintain the correct temperature of the supply water from the tower to the process. It does not have the design restrictions or added instrumentation of reducing the pump speed. However, the best strategy is not always the easiest. In most cases, the pump uses a great deal more energy than the fan. Sometimes controlling the pump speed first may make sense.
Varying fan speed
There are not as many restrictions on varying tower fan speed as there are with varying pump speed. Furthermore, not having static head makes the calculations less complicated. The only restriction is based on whether the fan is direct drive, belt or gear-driven. It’s always best to ask the tower manufacturer, but, in general, belt and direct drives should be able to operate down to 10 percent minimum, whereas gear-driven systems should be limited to 20 percent. The goal is to reduce fan speed to meet the tower supply water design temperature requirements, and for all intents and purposes you are done.
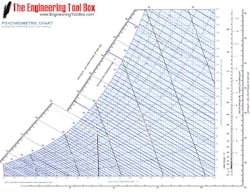
The Affinity Laws can help provide a rough idea of modeling the system. Looking at Figure 4, the outside temperature is 60 F, and the wet-bulb is 55 F. and our design supply water temperature is 85 F with a design approach of 7 F.
Figure 4. Outdoor temperature 60 F with a 55 wet bulb (Courtesy Engineering Toolbox)
Based on an approach of 7 F, we can calculate what the design wet-bulb would be by subtracting the design process supply water temperature of 85 F from the approach of 7 F or 85 – 7 = 78 F. Now that we know that, let’s determine how many CFM we would need to satisfy a 15 tower ton load at the design conditions. Looking at the blue line at the design wet-bulb of 78 F shows that the air contains roughly 41.5 BTU/Lb when the water gives up heat to the air, it causes the air to become saturated until it reaches 85 F at which point it has a BTU content of roughly 50 BTU. The difference therefore is (50 – 41.5) = 8.5 BTU. So every pound of air is able to produce around 8.5 BTU of cooling. The specific volume of the air as it enters the fan is around 14.4 cubic feet per pound (found by gauging the distance between the 14.0 and 14.5 specific volume lines on the chart). Therefore, to achieve 225,000 BTU/Hr cooling of the water (15 tower tons), the formula is:
CFM = BTU/Hr. X Specific Volume ÷ (BTU/Lb air leaving tower – BTU/Lb air entering tower) X 60
or:
CFM = 225,000 X 14.4 ÷ 8 X 60 = 6,750
So to produce 15 tower tons of cooling, we need the tower fan to produce 6,750 CFM. Now let’s assume that at 6,750 CFM, the tower fan is 15 horsepower. Given new conditions of a 60 F wet-bulb, how many CFM would we need?
Since the air leaving the tower does not change, the only thing that does change is the quantity of BTU/Lb, which is now roughly 50 – 28 or 22.
Now our equation becomes:
CFM = 225,000 X 14.4 ÷ 22 X 60 = 3,750
So now we only need 3,750 CFM to produce 225,000 BTU/hr or 15 tower tons. At this point the fan is running at 55 percent speed and the horsepower reduction would therefore be:
(6,750 ÷ 3,750)³ = 15 ÷ ?
Since (6,750 ÷ 3,750)³ = 5.832, the equation becomes:
15 ÷ 5.832 = roughly 2.6 horsepower
So how much did we save?
(15 – 2.6) = 12.4 horsepower converted to watts at 746 watts per horsepower is:
12.4 X 746 = 9,250.4 watts
Utility companies normally charge by the kilowatt hour, so if the fan ran at this condition for say 1,000 hours per year, and the utility cost was say 10 cents per KW hour, the savings would be roughly a little less than:
9.2504 X .1 X 1000 = $925.40 annually
Final thoughts
There are many things to consider when deciding how to optimize a cooling tower. Each project is different, and all factors should be considered. The goal here was to provide a basic understanding of some principals that hopefully give a foundation of understanding how to roughly predict a result. Every project should begin by understanding the limitations and variables involved to allow a fairly reasonable estimate of the return on investment. Understanding the variability of the heat load, utility cost and how outdoor conditions will affect the energy savings are the key issues.
There are many sources for weather data, which can be found on the Internet. The best starting point is to look for average wet-bulb conditions on the months the tower will be in operation. When looking at utility costs, it is always a good idea to understand your utility rate structure. These are usually available from your utility provider. More often than not, utility rates are tiered in such a way that the energy used in the upper tiers costs less than in lower ones. It is very likely that the energy you are able to reduce is from that upper tier so simply averaging the bill is not going to be very accurate. I always recommend that good practice with estimating savings is to be as conservative as possible.
John Pitcher is the CEO of Weber Sensors. Pitcher’s 40-year career covers many product development and leadership roles in the automation and energy efficiency fields. He can be reached at 770 592-6630 or [email protected].
