About the only thing that can dampen the world’s thirst for energy is a recession. This happened on a rather grand scale in 2009. However, since that time, many of the world’s economies have recovered. The U.S. economy, for example, has been in a slow but steady recovery the past several years. And China’s economy has been expanding at a fairly rapid pace, even though it has had some ups and downs. With recovering economies comes increased energy use, as construction projects come back online, production ramps us, and consumers spend more.
Today, Europe seems to be the region with the most economic difficulties. GDP (gross domestic product) statistics showed that the Eurozone had slipped into a mild recession by the end of September 2012. Europe’s problems began with Greek debt, and this contagion has migrated to several other countries as well, including Spain, Portugal and Italy. While the Eurozone is technically in recession, the contraction in the third quarter of 2012 was only 0.1 percent, so the recession is about as mild as possible. While such a mild recession may dampen energy use, it will not have nearly the impact as the 2009 recession.
Several other factors besides economic recovery are having an impact on energy consumption worldwide. One is the expanding population, which simply means that there are more people who need and use energy. The second factor is that people in developing countries continue to want a higher standard of living. This means more cars, more televisions, more houses, and generally more goods, all of which require energy to produce and consume.
5 Main Sources of Energy
There are five main sources of energy: oil, gas, nuclear, coal, and renewables. Most countries use the energy they have within their own borders, since it is cheaper and more efficient than importing energy. This is why China uses so much coal, despite its environmental impact, because coal is plentiful in China. Japan has very little in the way of oil and gas, so it has had to rely on coal, which it has some of, and nuclear energy. Japan imports oil and gas to make up the deficit. The United States consumes far more oil than it produces, so it imports oil. However, there is a trend in the U.S. to substitute natural gas for oil since the U.S. is rich in natural gas. This is due in large part to advances in the technology for extracting the abundant natural gas supplies in subterranean shale rock formations throughout the U.S.
Coal & Nuclear Still Widely Used
Coal is still widely used as a source of energy worldwide, especially in China. The biggest problem with coal is that plants burning coal emit significant amounts of pollution. Coal is the most CO2 intensive fossil fuel. Nuclear energy has its risks and dangers, as the incidents at Chernobyl and, more recently, Fukushima show. However, both coal and nuclear will continue to be used as energy sources, despite their dangers. There are inherent dangers in any form of energy, and countries and companies are attempting to address those dangers in a rational way.
Renewables Offer Hope for the Future
Renewables offer the potential for powering the world without polluting it or emitting CO2 into the air. Forms of renewable energy include wind, solar, geothermal, hydroelectric, fuel cells, and wave energy. Eventually the world will be forced to move to renewable energy as the finite supply of fossil fuels becomes exhausted. However, fossil fuels could last another 100 years, so the reign of renewables is still likely some time away.
The main problem with renewable forms of energy is that they, for the most part, are too expensive to compete effectively with fossil fuels. There are also obvious problems like how to gather wind energy when the wind is not blowing or how to rely on solar energy when the sun is not shining. The costs of renewable energy will come down as it is better researched, and its use will become more efficient as methods of storing renewable energy are improved.
Oil & Natural Gas to Dominate for Next 20 Years
Today, oil and natural gas supply a major portion of the world’s energy. While oil has been dominant for many years, natural gas is fast becoming more popular because of its wide availability and because it burns cleaner than oil. The recent discovery of shale gas has significantly increased the potentially recoverable natural gas worldwide. While the United States is in the forefront of shale gas mining, other countries are beginning to take advantage of this natural resource as well. For example, the first shale gas in Australia was pumped from a well in outback South Australia in October 2012.
While both oil and gas will be widely used in the next 20 years and beyond, the long-term odds favor natural gas. The world’s supply of crude oil is stable to declining. Oil experts debate the theory of “peak oil,” which is the point at which the total amount of oil production worldwide begins to decline irreversibly. While it is not clear whether that point has been reached, it seems likely that it will be reached sometime in the next five years, barring major unexpected finds of crude oil reserves.
The situation is quite different with natural gas. There are still vast untapped reserves of recoverable natural gas in the earth, and the discovery of shale oil only increases that amount. Some estimates are that there is enough natural gas in the earth to supply the world with natural gas for another 75 years. This estimated length of time could increase with further natural gas discoveries.
Where Is the ‘Measurement Action’?
Tracking oil and natural gas by production, reserves, imports, exports, and consumption is a major undertaking, especially if done by region, country, and company. This is important information for any flowmeter or instrumentation supplier who wants to know where the “measurement action” will be. Both oil and natural gas are measured as they come out of the ground, are transported to a refinery or processing center, and again as they are transported to distributors. Natural gas and oil are also measured at the point of distribution. Many of these measurements involve custody transfer, which requires that the flowmeters used conform to certain publicly approved standards.
Flow Research has already conducted a 2,900-plus page series of six research studies on natural gas that tracks natural gas by production, reserves, imports, exports and consumption. These five categories are also tracked by region, country, and producing companies. The studies also reveal flowmeter use for natural gas by region and by flowmeter type (www.gasflows.com). A parallel series of studies is nearly complete for oil and petroleum liquids (www.oilflows.com).
Oil
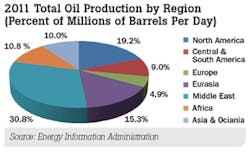
A look at a few key countries exhibits some interesting trends. According to the U.S. EIA (Energy Information Administration), the United States consumed 18.9 million barrels per day of petroleum products in 2011. At the same time, the U.S. produced 10.1 million barrels per day of oil. This is a difference of 8.8 million barrels per day, and it explains why the U.S. has to rely so heavily on imported oil, much of it from the Middle East. It also explains what people mean by saying “the United States must become energy independent” or “be self-sufficient in energy.” There are only two ways to do this—produce more or consume less. Of course, finding an alternative to oil, such as natural gas or solar power is one way to consume less oil.
Saudi Arabia presents a stark contrast to the United States. In 2011, Saudi Arabia consumed 3.0 million barrels per day of petroleum products. At the same time, Saudi Arabia produced 11.2 million barrels per day of oil. This is a surplus of 8.2 million barrels per day. In fact, Saudi Arabia is the world’s leading oil producer and exporter.
A look at the numbers for the entire Middle East explains why this region has a well-deserved reputation for being the leading source of oil in the world. In 2011, countries in the Middle East produced 26.9 million barrels of oil per day, while consuming only 7.9 million barrels per day of petroleum products. This is a surplus of 19 million barrels per day, much of which is exported. The leading oil producers in the Middle East after Saudi Arabia are Iran, United Arab Emirates, Kuwait, and Iraq.
Natural Gas
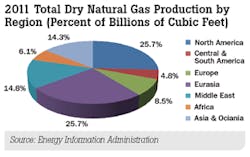
Unfortunately, the numbers for natural gas are less intuitive because the unit of measurement is billion or trillion cubic feet. However, the differences between production and consumption can still be appreciated. In 2011, the U.S. EIA reports that the United States consumed 24.3 trillion cubic feet of dry natural gas. At the same time, the U.S. produced 23.0 trillion cubic feet of dry natural gas in 2011. This means that the United States has come close to energy self-sufficiency in dry natural gas. Perhaps shale production will make up the difference. In fact, the U.S. has curtailed its imports of LNG (liquefied natural gas) due in large part to the added production from shale gas.
Implications for Flowmeters
Any company that wishes to sell flowmeters and other instrumentation into the oil and gas markets could benefit greatly from looking at where oil and natural gas production is occurring. Oil and natural gas reserves are important too, because they indicate where future growth lies. Imports and exports are also important because importing and exporting of oil and natural gas typically involves a series of custody-transfer measurements. Consumption when compared to production is a likely indicator of imports or exports, and consumption is typically measured. So data by country and region contains a wealth of information for any instrumentation supplier.
The leading flowmeters for oil flow measurement in terms of revenues in 2011 were Coriolis and differential-pressure (DP) fllowmeters with primary elements. Other important flowmeter types for oil flow are turbine, positive displacement, and ultrasonic. For natural gas, the leading revenue generators in 2011 were DP flowmeters, including primary elements, ultrasonic, positive displacement, and turbine.
Coriolis flowmeters are making great strides in measuring petroleum liquids, especially now that they are available for line sizes up to 16 inches. With the price of crude oil approaching $90 per barrel, end-users are looking for highly accurate and reliable measurements, which are strengths of Coriolis flowmeters. However, the traditional technologies of DP flow, positive-displacement, and turbine flowmeters are still well entrenched in petroleum liquid measurement. Positive-displacement flowmeters are widely used for measuring petroleum liquids at the distribution end as they are transferred to trucks, ships, and planes for transportation purposes. However, they are being displaced by Coriolis flowmeters in some of these applications.
In natural gas, multipath ultrasonic flowmeters are making inroads into DP and turbine flowmeters for custody transfer of natural gas. However, DP and turbine meters still have a large installed base since they received AGA approval long before ultrasonic meters. Positive-displacement flowmeters are widely used for utility measurement of natural gas.
The Future of Gas & Oil
Natural gas is sometimes described as “a long-term bridge to renewables.”However, the extent to which this occurs depends on the region and the country. China has made it clear that it intends to continue to use coal as a resource, which it has abundant amounts of, despite its effect on the environment. On the other hand, China does use significant amounts of natural gas. It is unlikely that natural gas will serve as a bridge to renewables for most countries in the Middle East, as long as they have such vast oil reserves.
In Asia-Pacific, where many countries are islands unconnected to pipelines, the use of LNG is growing rapidly. Australia is investing $54 billion in the Gorgon Project for the primary purpose of supplying LNG to the region. The first natural gas from this project is expected in 2014. Japan has very little oil and gas, and imports its natural gas in the form of LNG. China also imports significant amounts of LNG, while Malaysia and Indonesia are major exporters of LNG, with Qatar remaining the world’s leading LNG exporter.
Jesse Yoder, Ph.D., is president of Flow Research Inc. in Wakefield, Mass., a company he founded in 1998. He has 25 years of experience as an analyst and writer in process control. Dr. Yoder specializes in flowmeters and other field devices, including pressure and temperature products. Dr. Yoder can be reached at [email protected].


