OPEC oil output rose in September despite production curbs
OPEC crude oil production jumped in September month by nearly 90,000 barrels a day, complicating the cartel’s efforts to limit output and curb the global supply glut. Output by members of the Organization of the Petroleum Exporting Countries rose by 0.27 percent, to 32.75 million barrels a day in September, compared with the month prior.
The increase was driven by higher production in Libya, Nigeria, Iraq and Gabon, according to OPEC’s closely watched monthly oil market report. OPEC and other major crude producers like Russia agreed nearly a year ago to cap production at around 1.8 million barrels a day below peak October 2016 levels, with the aim of alleviating oversupply and boosting prices. But the deal has been undermined in part by a surge in production in Libya and Nigeria, the two member countries not included in the deal because their oil industries had been damaged by civil unrest. The news came a day after Saudi Arabia — OPEC’s largest member — said it would export 7 percent less crude by sea in November, compared with the same period last year.
Energy-related carbon dioxide emissions expected to rise in 2018
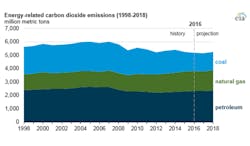
Energy-related carbon dioxide (CO2) emissions fell in 2015 and 2016, and they are expected to fall again in 2017, based on forecasts in EIA’s Short-Term Energy Outlook. However, the EIA forecasts a 2.2 percent increase in energy-related CO2 emissions in 2018. An annual increase is not without recent precedent; annual emissions rose in 2010, 2013, and 2014, although U.S. energy-related CO2 emissions have generally been declining since reaching their peak in 2007. Because total power generation is expected to increase in 2018, electricity generation from coal- and natural gas-fired sources is projected to increase by a combined 97 billion kWh. The resulting increase in coal and natural gas CO2 emissions in the power sector — 28 million and 29 million metric tons, respectively — combined accounts for 52 percent of the total projected increase in energy-related emissions in 2018.
RNG increasingly used to meet part of EPA’s renewable fuel requirements
Renewable natural gas (RNG), which is derived from biogas collected at landfills and other facilities, is increasingly used to meet government targets for renewable fuel production. In 2016, about 189 million gallons of RNG were used to meet about 82 percent of federal targets set specifically for cellulosic biofuel. The Renewable Fuel Standard (RFS) is a program implemented by the U.S. Environmental Protection Agency (EPA) to promote the incorporation of biofuels in the nation’s fuel supply.
Renewable natural gas is increasingly used to meet the cellulosic biofuel requirement. A 2014 EPA rule expanded the agency’s interpretation of cellulosic biofuel to include biogas consumed as compressed natural gas (CNG) and liquefied natural gas (LNG) produced at landfills, municipal wastewater treatment facility digesters, agricultural digesters, and separated municipal solid waste digesters. These biogases are then processed to be indistinguishable from pipeline-quality natural gas. RNG can be used to fuel CNG and LNG vehicles, which sometimes serve as alternatives to medium- and heavy-duty vehicles that would otherwise run on diesel fuel. The market for CNG- and LNG-fueled vehicles has increased over time, but it still represents a fraction (0.16 percent in 2016) of total natural gas consumption. Because RNG is generally more expensive than traditional natural gas, its demand is primarily based on its characteristics as a renewable resource that can help meet reduction targets for greenhouse gas emissions.
Propane supply for Midwest markets appears normal as heating season begins
The first week of October marked the start of the winter heating season. Propane inventories in the Midwest, Petroleum Administration for Defense District (PADD) 2, have increased in the past few weeks to reach levels near the five-year average (normal). However, the process and timing of inventories reaching their normal levels this year was unusual, likely because of disruptions on the Gulf Coast related to Hurricane Harvey.
Graphic courtesy of EIA
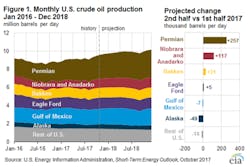
EIA’s close monitoring of current rig activity in several producing regions shows continued production growth from tight-oil formations, such as shale in the Permian region, driving overall production increases. Graphic courtesy of EIA
Permian Basin expected to drive fourth quarter US crude oil production increases
In its Short-Term Energy Outlook (STEO) update released this week, the EIA forecasts that U.S crude oil production will average 9.4 million barrels per day (b/d) in the second half of 2017, 340,000 b/d more than in the first half of 2017. The STEO projects that the most significant production growth in the second half of 2017 will be in the Permian region. Permian production is forecast to grow to 2.6 million b/d in the second half of 2017, a 260,000 b/d increase from the first half of 2017. Production in the Permian continues to increase, in part because of West Texas Intermediate (WTI) crude oil average monthly prices that have remained higher than $45 per barrel (b) since the second half of 2016.
Southern California natural gas pipeline outage halts regional storage injections
On Oct. 2, Southern California Gas Company (SoCalGas), a Sempra Energy utility, issued a critical notice that a key pipeline on its system was out of service. Line 235-2 in the North Needles Subzone — a key corridor for transporting natural gas across the state to coastal Southern California — was taken offline for repairs for an undetermined amount of time after an incident occurred near Newberry Springs, California. In the meantime, pipeline flows through the North Needles Subzone stopped, severely limiting the supply of natural gas from east to west and limiting storage injections into SoCalGas storage facilities. SoCalGas reported that the cause of the outage is under investigation.
Spark and dark spreads indicate profitability of natural gas, coal power plants
Relative profits for some natural gas- and coal-fired generators in several Midwestern and Mid-Atlantic states may have decreased since 2016 because of higher natural gas and coal prices and lower wholesale electricity prices. A common measure of profitability for power plants within a region is the difference between their input fuel costs, such as the cost of coal or natural gas, and their wholesale power price. Although PJM-region spark and dark spreads appear to indicate that natural gas-fired units have been more profitable than coal-fired units recently, many factors affect these calculations, including the selection of representative fuel prices, generator heat rates, fuel delivery costs, and time of year considered.
Graphic courtesy of EIA
Expected increase for US crude oil production through end of 2017
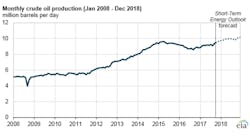
The EIA forecasts that U.S. crude oil production will average 9.4 million barrels per day (b/d) in the second half of 2017, 340,000 b/d more than in the first half of 2017. Production in 2018 is expected to average 9.9 million b/d, surpassing the previous high of 9.6 million b/d set in 1970, based on projections in the EIA’s Short-Term Energy Outlook (STEO). All historical production data in the STEO are benchmarked monthly to EIA’s Monthly Crude Oil and Natural Gas Production report and to EIA’s Petroleum Supply Monthly (PSM) estimates at the state level. The October STEO forecast for oil production is benchmarked to the PSM data for July that was published at the end of September.
US coal production decreased in first half of 2017 after increase in late 2016
U.S. coal production averaged 192 million short tons (MMst) per quarter in the first half of 2017, a slight decrease from the second half of 2016 but still above levels reached in the first half of 2016. The recent decline in production was a result of weaker demand for steam coal, about half of which is mined in Wyoming and Montana. The production of metallurgical coal, which is used in steel manufacturing and makes up about 8 percent of total U.S. coal production, increased for the third consecutive quarter. In contrast, average quarterly metallurgical coal production increased from 14.1 MMst in the second half of 2016 to 16.8 MMst in the first half of 2017, driven by higher worldwide demand, particularly from China, Japan and India. U.S. metallurgical coal exports to Asia increased as China, Japan, and India looked to offset disruptions to their supply of Australian coal caused by Cyclone Debbie in April 2017. In addition, China’s demand for metallurgical coal increased as its steel production reached record levels in June, according to the National Bureau of Statistics of China.
Graphic courtesy of EIA
US energy use in manufacturing decreases as output outpaces fuel use
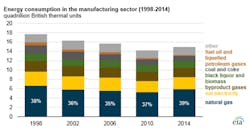
The energy intensity of U.S. manufacturing has continued to decrease, according to the latest data from the EIA’s Manufacturing Energy Consumption Survey (MECS). From 2010 to 2014, manufacturing fuel consumption increased by 4.7 percent, while real gross output increased by 9.6 percent — or more than twice that rate — resulting in a 4.4 percent decrease in energy intensity. On an economic basis, natural gas has become more cost competitive with coal and requires lower expenditures per unit of energy than fuel oil or liquefied petroleum gases.
Australian domestic natural gas prices increase as LNG exports rise
Australia became the world’s second-largest exporter of LNG in 2015 and is likely to overtake Qatar as the world’s largest LNG exporter by 2019. As Australia’s LNG exports have increased, primarily from LNG projects in eastern Australia, the country has had natural gas supply shortages in eastern and southeastern Australia and an increase in domestic natural gas prices. The western and eastern parts of Australia have separate natural gas and electricity markets and are not interconnected. Five states in eastern Australia — South Australia, Queensland, New South Wales, Victoria, and Tasmania — account for 86 percent of Australia’s population, and in 2016, LNG exports from eastern Australia accounted for 43 percent of the country’s total LNG exports.
The U.S. has considerably more natural gas storage infrastructure than Australia, which can help insulate markets from short-term supply disruptions that may lead to price spikes. In addition, estimates of natural gas reserves in eastern Australia have decreased in recent years, but U.S. natural gas reserve estimates have continued to grow.


