Demand pushes US refineries to run at near-record highs
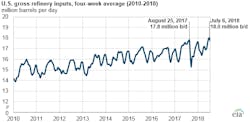
The four-week average of U.S. gross refinery inputs passed 18 million barrels per day (b/d) for the first time ever in July. Domestic and international demand for motor gasoline and distillate oil and driving the increase.
These levels have not been seen since Aug. 25, 2017, noted the U.S. Energy Information Administration (EIA), a week before Hurricane Harvey hit the Gulf Coast.
Refinery capacity, not utilization, increased by 862,000 barrels per calendar day between January 1, 2011, and January 1, 2018.
The Gulf Coast and Midwest regions account for most of the input levels. With more than half of all U.S. refinery capacity, the Gulf Coast hit its own record of 9.5 million b/d inputs the same week as the U.S. record was reached. The Midwest region, which has the second-highest refinery capacity, achieved a four-week gross refinery inputs record of 4.1 million b/d in June.
Graphic courtesy of the EIA
US fuel ethanol production increases over 2017
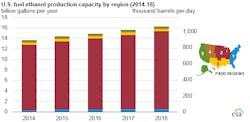
The EIA reported that at the beginning of 2018, U.S. fuel ethanol production reached more than 16 billion gallons per year, or 1.06 million b/d. This number represents a total listed operable ethanol plants increase of 5 percent between January 2017 and January 2018.
Part of the increase was caused by survey respondents who operated at higher levels than their listed production capacities, leading to utilization rates above 100 percent.
The Midwest region accounted for most of the fuel ethanol production capacity. It increased 5 percent from 2017 to 2018, or more than 650 million gallons per year. Iowa, Nebraska and Illinois make up more than half of U.S. total ethanol production capacity.
Graphic courtesy of the EIA
North Sea projects to rely on subsea tiebacks
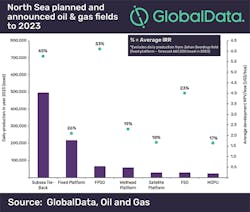
Data analytics company GlobalData reported that of the 63 oil and gas fields to be brought into production in the North Sea between 2018 and 2023, 34 will be subsea tiebacks. Companies are expected to spend $69 billion on projects in the region, with $14 billion to be spent on subsea tiebacks.
While the Gulf of Mexico will have a higher ratio of subsea tiebacks during this time period (23 of 30 projects), North Sea subsea developments have a higher average internal rate of return of 45 percent compared to the Gulf’s 32 percent for the same type of development.
GlobalData Oil & Gas Analyst Luis Pereira commented that tiebacks are ideal for operators interested in maintaining the short- to medium-term production outlook since average payback time is less than six years.
Graphic courtesy of GlobalData
South Central natural gas capacity to increase
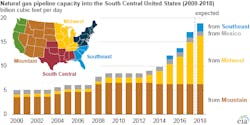
The South Central region of the U.S. is expected to see an increase in natural gas capacity to nearly 10 billion cubic feet per day (Bcf/d), representing a shift from being a source of natural gas supply to a source of growing demand. Pipeline projects scheduled to come online in 2018 will create more supply for the Gulf Coast and support growing export markets.
Liquefied natural gas (LNG) export facilities contribute to the increase. New facilities planned to come online in 2018 and 2019 represent an additional 6.1 Bcf/d of LNG export capacity. These facilities require infrastructure to deliver the natural gas to liquefication terminals.
Natural gas exports to Mexico will also grow. Pipeline exports from Texas into Mexico alone has grown from 0.9 Bcf/d in 2010 to more than 4.3 Bcf/d through April 2018. Pipeline capacity tripled during the same timeframe, reaching 9.3 Bcf/d in 2017.
Graphic courtesy of the EIA
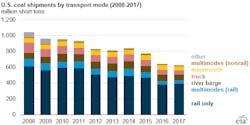
Coal shipments slump to lowest levels since 1983
The electric power sector consumed 661 million short tons (MMst) of coal in 2017, the lowest amount since 1983. This made 2017 the fourth year in a row that U.S. coal consumption shipments by all transport modes declined. Most of the coal (nearly 70 percent) was shipped by rail in 2017, with the rest shipped by river barge, truck and other methods.
Coal consumption by the electric power sector reached its highest level in 2008. 2017 levels were 36 percent lower. While coal shipped by rail has declined 33 percent since 2008, coal shipments by river barge have grown from 7 percent in 2008 to 12 percent in 2017. Illinois Basin coal producers rely on the Ohio River for much of their production.
Graphic courtesy of EIA

