Crude oil and petroleum product exports reach record levels in the first half of 2017
Crude oil exports in the first half of 2017 increased by more than 300,000 barrels per day (b/d) from the first half of 2016, a 57 percent increase. Petroleum product exports grew over the same period as well. Crude oil and propane exports each reached record highs of 0.9 million b/d, and distillate exports reached a record of 1.3 million b/d. Although crude oil exports during the period grew, the growth rate in the first half of 2017 was lower than in the first halves 2013, 2014 and 2015 when exports increased at year-over-year rates of 88 percent, 134 percent and 70 percent, respectively. Distillate exports in the first half of 2017 outpaced those in the first half of 2016 by 14 percent, with exports to South and Central America accounting for nearly 70 percent (114,000 b/d) of this growth. Since 2014, total U.S. propane exports have grown with the expansion of export infrastructure.
Graphic courtesy of EIA
Global gas-to-liquids growth is dominated by two projects in South Africa & Uzbekistan
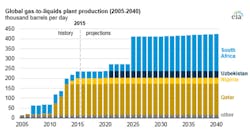
The EIA’s International Energy Outlook 2017 (IEO2017) projects that liquids produced at gas-to-liquids (GTL) plants will increase as two large-scale projects are completed in South Africa and Uzbekistan. Most of the new GTL capacity will come from the conversion of Sasol’s coal-to-liquids plant in Secunda, South Africa, to a GTL facility. That conversion is expected to be completed by 2024. In the IEO2017 High Oil Price case, world crude oil prices are assumed to be much higher than in the IEO2017 Reference case, which provides an incentive to construct new GTL plants or add capacity at existing plants. In the high oil price case, global GTL production continues to increase from 2025 through 2040. In the low oil price case, the Uzbekistan project is still assumed to come online, but no other projects (including the South Africa plant) come online after 2021.
Puerto Rico’s electricity service slow return leaves LNG imports on hold
Most residents of the U.S. territory of Puerto Rico are still without power after extensive damage from Hurricanes Irma and Maria. As of Oct. 4, 2017, 9 percent of Puerto Rico Electric Power Authority (PREPA) customers have restored service. Portions of Arecibo, Ponce and Hatillo are partially energized. Other municipalities also partially energized include San Juan, Bayamón, Mayagüez, Carolina, Cataño and Guaynabo.
The last liquefied natural gas (LNG) import cargo was offloaded on Sept. 8, just before hurricane Irma arrived. All 15 LNG cargos imported in 2017 were from Trinidad and Tobago. None of Puerto Rico’s LNG imports into Peñuelas came from the United States because none of the LNG shipping vessels in the global fleet can meet all the Jones Act requirements. However, on Sept. 28, the Department of Homeland Security issued a waiver for the Jones Act, valid for 10 days, to ease restrictions on shipments of relief supplies from the U.S. mainland to the island. LNG shipments into Peñuelas will likely be suspended until the two power plants it serves resume service.
Image courtesy of EIA
Natural gas inventories remain lower than last year, but higher than the five-year average
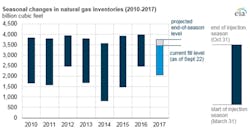
Working natural gas inventory levels in the lower 48 states since April have been lower than they were in 2016, according to EIA’s Weekly Natural Gas Storage Report (WNGSR), but they are still higher than the previous five-year average (2012 to 2016). For the week ending Sept. 22, natural gas storage levels were 127 billion cubic feet (Bcf) lower than at the same time last year but 41 Bcf higher than the previous five-year average. EIA’s Short-Term Energy Outlook projects natural gas inventories in the Lower 48 states to reach 3,755 Bcf by the end of October, about 48 Bcf lower than the previous five-year average and 222 Bcf lower than at the end of October 2016, when inventories reached 3,977 Bcf.
US household spending for gasoline is expected to remain below $2K in 2017
The average U.S. household expenditure on gasoline in 2017 is expected to total $1,977, or approximately 2.4 percent of mean incomes of households, according to projections in the EIA’s most recent Short-Term Energy Outlook (STEO). The most recent peak for household gasoline expenditures was $2,715, or 4 percent of household income, in 2008. Lower gasoline prices have contributed to decreasing household gasoline expenditures since 2012, as gasoline consumption has generally increased. The STEO estimates that gasoline prices will average $2.48 per gallon in 2017, which is 33 percent lower than the price in 2012.
Graphic courtesy of EIA
Chinese coal-fired electricity generation expected to flatten as mix shifts to renewables
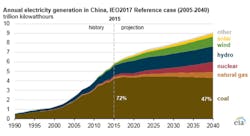
Coal-fired electricity generation in China, the world’s largest coal consumer, is expected to remain flat through 2040, according to EIA’s International Energy Outlook 2017 (IEO2017). Other fuels, such as renewables, natural gas, and nuclear power, are expected to make up increasing shares of China’s electricity generation. Coal remains China’s largest source of electricity, accounting for more than 72 percent of the nation’s electricity generation in 2015. By 2040, fossil fuels (coal, natural gas, and petroleum) are still expected to make up most of China’s electricity generation mix. The EIA expects electricity generated from natural gas to grow by 6.5 percent between 2015 and 2040, with an addition of 70 GW of natural gas capacity. Current renewable generation in China is dominated by hydroelectricity, which is the country’s second-largest source of generation after coal. Wind and solar currently account for relatively small amounts of generation, at 2.7 percent and 0.5 percent, respectively. China’s most recent Five-Year Plan also set a target for the addition of 58 GW of nuclear capacity by 2020. Currently, China has 38 operational nuclear power reactors and another 19 under construction.
Nuclear power plant outages relatively low in summer 2017
U.S. nuclear power plant outages averaged 4.6 GW during the summer of 2017 (June through August), 10 percent lower than outages during the summer of 2016. Nuclear outages were highest in June, averaging 7.4 GW, but then averaged 3.8 GW in July and 2.6 GW in August. Nuclear outages are typically lowest during the summer and winter months when electricity demand is relatively high. Outages can be either scheduled or unscheduled, and they can range from a partial outage, where only some of a plant’s capacity is offline, to a full outage, where the entire plant is shut down.
Two significant forced outages in Tennessee and Texas affected the summer outage capacity in 2017. The newest U.S. nuclear power plant, Watts Bar Unit 2, located in southeastern Tennessee, shut down because of a steam condenser failure on March 23, only five months after it first started producing electricity. Hurricane Irma led to an unscheduled outage at both of Florida’s nuclear power plants: Turkey Point and St. Lucie. The Turkey Point plant, on Florida’s southeastern coast near Miami, was forced into unscheduled shutdown and reduced its output starting Sept. 9.
US federal government energy costs at lowest point since fiscal year 2004
According to the Federal Energy Management Program (FEMP), the total real energy cost for the U.S. federal government to operate its facilities, vehicles, and equipment in fiscal year (FY) 2016 fell to $16.1 billion, the lowest level since FY 2004. Total site-delivered energy consumption by the U.S. federal government fell slightly in FY 2016 to 0.92 quadrillion British thermal units (Btu), the lowest on record since data collection began in FY 1975. The main contributor to lower total energy costs is the sharp decline in per-unit energy costs. In FY 2016, real per-unit energy costs were $17.56 per million Btu, down 23 percent from the prior year and at their lowest level since FY 2007. Because crude oil prices in FY 2017 averaged $9 per barrel more, or about 21 percent higher, than in FY 2016 and with estimates of DoD operational energy consumption in FY 2017 slightly higher than in FY 2016, the EIA expects total energy costs for the U.S. federal government to increase in FY 2017.
Graphic courtesy of EIA
Nuclear power plant retirements increase & natural gas-fired generation capacity grows
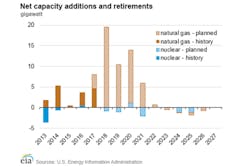
In the past seven years, six nuclear power plants announced their intentions to retire early. The most recent announcement came in May from Exelon’s Three Mile Island power plant in Pennsylvania. These six plants have a current operational capacity of about 7.2 gigawatts (GW) with an average capacity factor of 95 percent. In addition to these plants, construction of South Carolina Electric and Gas Company’s 2.2 GW (capacity factor of 100 percent) VC Summer power plant was halted in July. While nuclear capacity is expected to decrease in the next 8 years by 7.2 GW, announced builds at natural gas-fired power plants will offset some of the lost capacity. Dry natural gas production has increased steadily over the past decade, averaging 72 billion cubic feet per day (Bcf/d) over 2014 to 2016. In 2016, the national average wholesale price for electricity was about $30 per megawatt hour (MWh), about 17 percent lower than in the previous year.
State taxes on gasoline in 2017 up 4.5 percent from 2016
In the EIA’s latest update of state gasoline and diesel fuel taxes data, the simple average of taxes and fees on gasoline levied by the states and the District of Columbia in effect as of July 1, 2017, was 27.9 cents per gallon (¢/gal), up 4.5 percent from the same time last year. These taxes and fees range from a low of 8.95¢/gal in Alaska to a high of 59.3 ¢/gal in Pennsylvania. Gasoline buyers in the United States pay these taxes at the pump in addition to the federal tax of 18.4 ¢/gal, which has remained unchanged since 1993. State taxes on diesel tend to be somewhat higher — averaging 28.6 ¢/gal and ranging from 8.95 ¢/gal in Alaska to 75.8 ¢/gal in Pennsylvania. The federal tax on diesel of 24.4 ¢/gal is slightly higher than the federal tax on gasoline.
In addition to already existing tax changes at the time of publication, the STEO also accounts for future approved tax increases, such as California’s planned 12 ¢/gal increase set to begin on Nov. 1. California represents a major portion of West Coast (PADD 5) gasoline consumption, so changes in California’s fuel taxes are expected to contribute to larger differences between West Coast retail and U.S. average wholesale gasoline prices in the STEO forecast.


