Larry Bachus
(a.k.a. “Pump Guy”)
Hello Larry,
I am an operator at a South American refinery. I attended your pump course two months ago. In the pump course, you urged us to study the performance curves of our pumps.
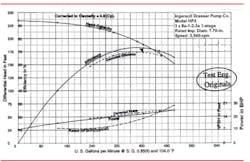
When I returned to the refinery, I requested the curve of two pumps in my area to analyze them. The curves appear different from the curves we studied in class, as well as the performance curves in your pump book. I’ve provided the pump curves here.
The little triangle shows flow at 400 GPM and 72 percent efficient, but I don’t see the NPSHr on the curve. Also, I don’t see minimum suction pressure or discharge pressure on the curve.
Larry, if you can help me with this information, I can teach the other operators here who couldn’t come to your excellent pump course. Any assistance would be much appreciated.
Harry B.
###Hello Harry,
So, the pump factory will test one pump out of every 100 or 200 or 5,000 production models, and verify that the pumps are performing as the curve indicates they should. The family curves represent the average or overall performance of a production model of pump tested on 70 F Water at sea level conditions.
At the automobile dealership, the sticker on the window might say your car model gets 28 miles per gallon of fuel on the highway. This doesn’t mean that they verified the fuel consumption of your specific car on the factory test track; it means they tested a few models of your car and your model typically gets 28 MPG.
Sometimes, as a condition of purchase, a pump user wants to know the specific performance characteristics of the very pump that will be shipped to the process plant. In this case, the pump user requests a “Certified Application Specific Curve.” Different pump manufacturers may use other names for this certified curve.
The certified curve also shows the performance of the exact impeller diameter (7.70-in.) of your application. The family curve might only show the performance of the seven-inch impeller and the eight-inch impeller. As such, the certified curve closely represents the performance of the exact pump and liquid at your plant.
Although the information is adjusted, the certified curve shows the standard elements of all pump curves. It shows the differential head and flow, NPSHr, efficiency, corrected efficiency, power consumption, and corrected power consumption of your pump with your impeller diameter (7.70-in.) and motor speed (3,540 RPM) and your liquid.
Differential head and efficiency are plotted on the left side of the curve. NPSHr and power consumption are plotted together on the right side of the curve.
With the NPSHr, a safety factor, the conversion 2.31 and specific gravity, you can calculate the minimum acceptable suction pressure in PSI. Likewise, you can convert differential head into differential pressure added into the system by the pump.
The sum of the suction pressure and added pressure equals the expected discharge pressure in PSI. You can also calculate the suction-specific speed, specific speed, and Kw consumption. So everything you need to know about a given pump is available on that certified curve.
The certified curve also shows the little triangle we discussed in class. Design engineers have a tendency or habit of drawing a little triangle on the pump curve at the proposed head and flow duty coordinates. The triangle misleads production and process engineers. They mistakenly think their pump will really perform at these coordinates all day long, all month long, all year long.
Process pumps constantly move or migrate on the curve as the system changes. The system drags the pump to the left and right on its curve as downstream valves are manipulated, as downstream filters and strainers clog with debris, as levels rise and fall in the tanks, and as header pressures vary.
When the design engineer draws the little triangle on the pump curve, he indicates the system is static with no change. The little triangle leads plant engineers to assume the pump doesn’t need proper instrumentation to track its movement on the curve.
You might remember we spent a lot of time in the pump class developing dynamic system curves and mating the dynamic system into the efficiency arcs of the pump curve.
The day process engineers, maintenance engineers, and purchasing agents learn this technique; they’ll drastically improve the service life of their pumps. (Some people might say MTBF, but I hate buzzwords.)
Harry, your career with pumps is a continuing education. Never stop studying and learning. Your question inspired me to write this article. Thanks.
Larry Bachus,
The Pump Guy
The text of this article was translated from Spanish to English.
Larry Bachus, founder of pump services firm Bachus Company Inc., is a regular contributor to Flow Control magazine. He is a pump consultant, lecturer, and inventor based in Nashville, Tenn. Mr. Bachus is a retired member of ASME and lectures in both English and Spanish. He can be reached at [email protected] or 615 361-7295.


