Shale gas remains a phenomenon in the U.S., turning one of the most energy-hungry countries on the planet into a natural gas exporter in a few short years. November 2016, for instance, saw the second-ever shipment from the U.S. heading to China as the country worked toward a record level of exports.
The changing patterns of energy supply and demand are not only raising issues of quantity, however, but also quality. Composition and parameters such as the calorific value that determine values can change daily. Variation is the new normal.
For larger pipelines fed from multiple wells, significant variations in the composition can be present. Without accurate metering at entry and exit points, operators cannot be confident supplies meet agreed energy (British thermal unit [Btu]) values and risk either contractual breaches or costly giveaways to end customers.
In some cases, gas chromatographs, the traditional equipment used to determine the composition of natural gas streams and identify the proportions of methane, propane, butane and oxygen, are simply not up to the task.
Missing energy
This can be illustrated by the case of a large U.S. pipeline company.
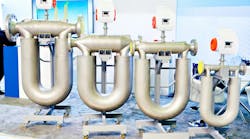
The pipeline has multiple points of gas entry, with about a dozen inlet stations drawing from a range of suppliers in a regional shale production zone. To ensure the natural gas meets minimum energy values for its customers, the pipeline company requires suppliers to provide gas with no more than 2 percent of carbon dioxide (CO2). To meet this, each inlet has CO2 membrane-style separators. CO2 and hydrogen sulfide (H2S) are sent through a compressor to a second membrane unit, from which the “permeates” are sent to flare, while the residual hydrocarbons and nitrogen gas (N2) flow into the pipeline (see Figure 1).

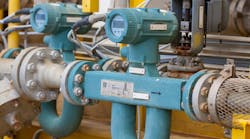
The company had an ultrasonic custody grade meter and gas chromatograph (GC) in place at each inlet. These measured composition ratios and calculated energy content for Btu billing purposes. The composition readings also fed a flow computer that was used to solve AGA 8 compressibility and yield a standard volume rate and total. This in turn was used to calculate an overall energy rate and total.
Despite this, the pipeline found customer deliveries consistently recorded lower total BTUs than the sum metered at the points of entry. The quality of gas at the inlets was evidently falling below the required levels (with greater than 2 percent CO2), yet this was not being detected by the GC.
In fact, what was happening was that suppliers were randomly — but regularly — shipping gas with a CO2 content higher than the separator’s maximum capacity. This was detected by the membrane protection system, which monitors the pounds per square inch differential (psid) — or differential pressure — across the membrane. It would then activate a valve to bypass the separation membrane section, dumping the high CO2-content gas straight through to the pipeline, until the psid fell back within the unit’s capacity.
These bypass periods were brief, usually no more than 10 seconds. During this time, however, the CO2 levels were regularly up to 14 percent. The result of the fugitive CO2 dumping was enough to significantly alter the composition of the entire pipeline flow.
This was a substantial drain on the company’s revenue. A test monitoring the system over seven hours found an average dump lasted (typically) 10 seconds out of every 100 seconds, with CO2 levels of 14 percent, i.e., 1.4 percent higher than the contracted requirement. About 14 percent of the gas volume during these dumping periods had no Btu value from that supplier. While the inlets were not overflowing the CO2 separators continually, they were bypassing and dumping about 10 percent of the time. Approximately 20 percent of the multiple suppliers were similarly overrunning their CO2 separators.
This meant that the gas received from that one of several suppliers, over a 24-hour period was about 1.4 percent lower in Btu/standard cubic feet (scf) than was metered and billed at the inlet (the GC sample rarely occurred during the start of a random dump cycle). The 10-second dumps per 100 seconds was when they overran the separators; They did not overrun them 24 hours per day. The result, once the high CO2 streams blended with the rest of the gas in a long, large diameter pipeline, was that the 1,010 Btu/scf expected at the inlet was really delivering an average of approximately 996 Btu/scf at the supplier’s outlet into the main pipeline.
The portion of the total pipeline gas with a few suppliers overrunning their separators (and the majority of the pipeline entry suppliers not overrunning their separators) resulted in a lost revenue of approximately 0.3 percent on the total pipeline energy billings on more than 2 Bscf/day (60 Bscf/month) at the prevailing price of $3.50/mscf at the time added up to $630,000 per month.
A question of timing
The gas chromatographs were not detecting the CO2 dumps because dumping periods were brief.
The GC sampled gas across three streams, taking a brief sample (less than a second) from each in turn, with analysis taking four minutes. Consequently, the GC sampled less than one second of any individual stream’s flow and on the three-stream GC only once every 12 minutes (720 seconds). The high CO2 dumps, meanwhile, occurred for just 10 seconds at a time with 90 seconds or more between them. Therefore, these were largely invisible to the GC sampling, which could easily have missed nine to 10 dumps in a row (or more) and not have seen the excess CO2 for two hours. This was not a weakness unique to a GC. In practice, the irregular pattern of brief, high CO2 dumping would not have been visible diagnostically with an orifice or turbine meter, either.
Instead, the issue was ultimately detected using the ultrasonic meters in place at the inlets. The two inlet stations that delivered closest to their design maximums were chosen for the test.
Two laptop computers were logged in remotely to each station, one to the ultrasonic meter and one to the GC. On the ultrasonic meters, the computer monitored one diagnostic parameter: average velocity of sound (VOS), which updated each second. Since CO2 is extremely sound energy-absorptive, a sudden increase in CO2 would be reflected in a substantial drop in the average VOS (measured in feet per second). The laptop for each station that was logged into the GC, meanwhile, recorded the composition component breakdown of each sample’s analysis.
The test brought almost immediate results. Within a few minutes, the ultrasonic meter showed the VOS fall rapidly, remain low for about 10 seconds and then return to its previous level. Throughout this time, no sample was taken by the GC, leaving no trace of the event on the GC. The same thing happened one to two minutes later, and again after that. This same pattern was observed on both stations.
Assuming a CO2 bypass was the only rational culprit for the VOS drop, simulations were run using AGA 10 to find the level of CO2 required for the drop observed. The CO2 content was deliberately increased and renormalized, and a new VOS was calculated until it matched the observed VOS. A 14 percent level of CO2 was required for match. This was confirmed by one of the GC samples, which finally coincided with a period where a bypass/dump occurred. It, too, registered a 14 percent CO2 content.
Wider problem, better solution
While the ultrasonic meter immediately identified the drop in VOS, this was not monitored or alarmed at the station. The GC, meanwhile, could — and did — miss these injection excursions for hours.
This is not a unique problem. The custody stations were Class A. Shale gas pipeline gas quality is known to be variable, and many other businesses have reported energy imbalance issues. Transportation or sales outlets, for instance, often have regional limits for quantities of separated butane and are charged at least some revenue for any excess. However, fugitive brief dumps of butane entering a pipeline can, like CO2 and for the same reason, go undetected, leaving the businesses with higher levels of butane than contractually agreed.
An obvious answer to such problems is to take advantage of modern technology for real-time online quality analysis. This can provide continual monitoring and key composition details, such as Btu and CO2 measurements, in seconds, with little loss of accuracy. As an example, the Btu measurements from online analysis taken using a gas quality analyzer closely mirror results for the same stream taken from a gas chromatograph. The key difference is that the measurements from the analyzer are available in seconds rather than minutes.
In a high-volume pipeline inlet station with immediate pre-pipeline entry CO2 separation such as the one discussed, this online analysis could not only identify CO2 (or butane) injections immediately but could also be used as a control field variable to throttle back the flow rate when it overran the separators. The ultrasonic meter’s VOS measurement, meanwhile, would provide independent confirmation to give an additional level of confidence to support and fine-tune this automatic control.
The natural gas industry is changing fast. Increasingly, approaches to gas analysis will be required to reflect this. Traditional gas chromatographs provide accurate gas analysis but also require long analysis times. In many applications, this no longer provides the level of analysis — or flexibility — the industry demands.

Charles Derr is a senior consultant, sales support, for gas measurement and control for Honeywell Process Solutions. He is an electronic technologist who received his education at the 3345th USAF Technical School and at the University of Houston. He began his work at the 111th Fighter Group as a specialist on the McDonald Douglas F-101’s Honeywell integrated flight and guidance control systems in 1971. He was later a digital circuits designer at Texas Instruments and joined the energy industry full time in 1976 where he has worked to-date specializing in flow measurement and is particularly specialized in ultrasonic meters wherein he holds several U.S. patents. His primary function is as a flowmeter applications specialist to provide support and to use application experience to form new applications for flow measurement devices to solve critical measurement/control needs and to integrate them into existing and new systems.