Most people remember the recession of 2008, a worldwide economic downturn marked by negative economic growth and financial hardship for many companies and individuals. Because this was the worst economic downturn since the Great Depression, it has come to be known as the Great Recession. Today, some economic analysts put the beginning of the Great Recession at December 2007 and its end at June 2009. Even though it may have officially ended in mid-2009, its effects lingered through 2010 and into 2011.
The worst quarter during the Great Recession in terms of gross domestic product (GDP) was Q4 2008, when U.S. GDP contracted by 8.2 percent. GDP levels continued to decline in the first two quarters of 2009. In Q3 2009, GDP grew by 1.3 percent, marking the official end of the Great Recession. Home prices fell about 30 percent during this period.
Other important indicators include a rise in the unemployment rate from 5 percent in December 2007 to a high of 10 percent in October 2009. The Dow Jones Industrial Average reached what was then an all-time high of 14,164.53 on Oct. 9, 2007. As the Great Recession developed, a number of major companies in the banking sector reported massive losses. These included Countrywide, American International Group Inc. and Bear Stearns. General Motors Co. and Chrysler required and received government bailouts. By March 9, 2009, the Dow bottomed out at 6,457.05.
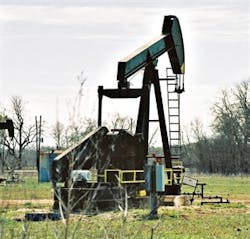
A pumping jack in an oil field near Houston, Texas.
Effect on flowmeter markets
The worldwide flowmeter markets do not necessarily rise and fall with the state of U.S., European and Asian economies. However, since flowmeter companies sell into the process industries, including oil and gas, chemical, food and beverage, and others, they can be affected by broad-based economic events. The Great Recession had a systemic effect on many large and small companies, including flowmeter suppliers and the process industry companies that purchase flowmeters for their manufacturing and industrial operations.
The oil and gas industry, including upstream, midstream, downstream and refining, accounts for between 20 and 30 percent of flowmeter revenues for many types of flowmeters. As a result, the strength of the oil and gas industry has a major impact on the business of many flowmeter and instrumentation companies. This impact is more direct than the broader impact of a downturn in the economy as a whole. And the strength of the oil and gas industry is in many ways tied to oil prices.
The price of oil especially has an effect on the upstream and midstream oil markets. When oil prices are high, e.g., above $70 per barrel, many oil and gas exploration projects are profitable that are not profitable at lower prices such as at $40 per barrel. Oil prices fluctuate depending on many factors, including environmental, political, currency and speculative factors. Unfortunately for many instrumentation companies, the Great Recession of 2008 was accompanied by a dramatic drop in the price of oil. In July 2008, West Texas Intermediate (WTI) crude oil sold for more than $145 per barrel. By December 2008, the price of WTI had dropped to a range near $31 per barrel.
The combined effect of the Great Recession and the drop in oil prices had a significant impact on new-technology flowmeter markets in 2009. It affected the Coriolis, magnetic and thermal flowmeter markets most severely, all of which declined in 2009. However, in 2010, all the new-technology flowmeter markets rebounded from 2009 levels. This rebound continued in 2011. In 2012, all these flowmeter markets showed an increase, but not as strong as the increase in 2011. The 2012 increases looked a lot like those in 2008, and were more in line with expected annual averages.
Oil prices in 2015
In 2015, flowmeter markets experienced a downturn similar to the one in 2009, although it was not as pronounced. This was not caused by a global recession, since the U.S. and many world economies experienced growth in 2015. Instead, it was mainly because of a drop in oil prices that began in August 2014.
Why did prices begin to decline in August 2014? One major reason is an increase in U.S. oil production. Most analysts attribute the increase in U.S. oil production to shale plays and the new use of technology in them. Through the process of hydraulic fracturing, or “fracking,” it is possible to obtain oil from wells that were once thought to be dry, or nonproductive. This process has significantly increased the total crude oil production in the U.S. and other countries. Fracking has become somewhat controversial because of its environmental effects, which are still being studied. Even so, the increased use of fracking technology is one of the major reasons for the increase in oil supply and for the resulting imbalance of supply and demand.
The Organization of Petroleum Exporting Countries (OPEC) often responds to declines in oil prices by cutting production to maintain higher prices. However, in November 2014, OPEC decided not to cut production despite a significant decline in oil prices. Many analysts believe this was an attempt to undercut the U.S. shale industry. OPEC’s decision not to cut production in November 2014 meant that OPEC countries continued to produce as much oil as before.
While oil was trading in the $70 per barrel range at the time of the November 2014 OPEC meeting, it traded lower after the meeting. Oil prices continued to decline in 2015, dropping below $40 per barrel in August 2015. Finally, oil prices reached a low of just above $26 per barrel on Feb. 11, 2016.
The impact of lower oil prices
The new-technology flowmeter markets experienced a downturn in 2015. This includes Coriolis, ultrasonic, vortex and thermal flowmeters. The exception to this was the magnetic flowmeter market, which experienced a modest increase. Of course, magnetic flowmeters are not widely used in the oil and gas industry since they cannot be used to measure the flow of hydrocarbon liquids.
The extent to which individual companies were affected by the economic downturn varies with their focus on the oil and gas industry as opposed to chemical, power, water and wastewater, or the other process industries. Some companies dealt with the downturn by emphasizing instrumentation products sold into nonhydrocarbon industries. Other companies with substantial focuses on the oil and gas industry suffered sales declines in their instrumentation businesses in 2015.
Brighter days ahead
OPEC had another meeting on June 2, 2016. At that time, the organization discussed a production freeze but could not agree on it. The main sticking point was a disagreement between Saudi Arabia and Iran. Iran declined to participate in an oil production freeze until its production, measured in barrels per day, had reached presanction levels. Saudi Arabia would not agree to the freeze without Iran’s participation.
Despite their lack of agreement, oil prices by then had almost doubled from the February low, and they closed at more than $51 on June 8, 2016. The reason for the increase was a combination of decreased supply and increased demand along with supply disruptions. Nigeria, Libya and Venezuela experienced disruptions in supply during this time.
On Sept. 28, 2016, OPEC met in Algiers, Algeria, and agreed on the framework of a production freeze. While oil had declined since June 2016, it closed once again above $51 per barrel on Oct. 10, 2016. Even though the future remains uncertain, higher oil prices appear to be in the offing. This is good news for flowmeter and other instrumentation suppliers, especially those with a focus on the oil and gas industry.
Jesse Yoder, Ph.D., is president of Flow Research Inc. in Wakefield, Massachusetts, a company he founded in 1998. He has 28 years of experience as an analyst and writer in instrumentation. He holds a U.S. patent on a dual-tube meter design and is the author of The Tao of Measurement, published by ISA. Yoder also founded the Flowmeter Recalibration Working Group, addressing the topic of recalibration frequency. He may be reached at [email protected].


