Globally, the heat transfer fluid (HTF) market is estimated to reach $2,557 million by 2017 and the solar sector is a key part of this market. The most common fluid used in concentrated solar power plants is the eutectic mixture of biphenyl and diphenyl oxide. This article provides new insights into the optimal sampling frequency for a solar HTF and the cost of sampling the fluid.
Eutectic mixtures of biphenyl and diphenyl oxide (BDO) HTFs are commonly used as a heat carriers in concentrated solar power (CSP) plants.1 2 At the congress entitled ‘SolarPACES’, C. Lang and B. Lee presented a paper entitled ‘Heat transfer fluid life time analysis of BDO grades for concentrated power plants’3 which, for the first time, provides clear information on the actual frequency that a BDO-based HTF should be sampled. This is important because it is based on real-life data and can be used to advise customers using this particular HTF.
Several well-known HTFs contain BDO, including Dowtherm A and Therminol VP-1.2 4 The paper focuses on the modelling of thermal degradation of Dowtherm A and a non-branded, BDO chemically equivalent BDO HTF. The objectives were twofold:
- To compare the thermal degradation of two BDO HTFs (Dowtherm A and a non-branded variant)
- To compare the top-up volume and cost over the lifetime of a BDO HTF
The degradation model incorporated three factors, of seven cited, involved to the degradation of an HTF. These included fluid temperature, initial impurity concentration (organic and inorganic) and the concentration of degradation products. Laboratory data was used to determine a theoretical rate of degradation for BDO HTFs. Theoretical values were then normalized using real HTF degradation data obtained from fluids used in CSP plants, presumably based on data obtained for Dowtherm A. The authors concluded that non-branded BDO HTF was 1.7 to 2.4 times more likely to degrade than the banded BDO HTF. And that annual top-ups cost $2 per kilogram over the course of a 25-year life span.
| Non-branded BDO HTF | Branded BDO HTF | |||
| Degradation | HTF samples per year | HTF samples over 25 year | HTF samples per year | HTF samples over 25 year |
| 1% | 0.8 | 19.2 | 0.6 | 13.9 |
| 2% | 1.7 | 41.7 | 1.1 | 27.8 |
| 3% | 2.0 | 50.0 | 1.4 | 35.7 |
| 4% | 2.0 | 50.0 | 1.7 | 41.7 |
| 5% | 2.5 | 62.5 | 2.0 | 50.0 |
| 6% | 3.3 | 83.3 | 2.5 | 62.5 |
| 7% | 3.3 | 83.3 | 2.5 | 62.5 |
| 8% | 3.3 | 83.3 | 2.5 | 62.5 |
| 9% | 3.3 | 83.3 | 3.3 | 83.3 |
Table 1. Estimated sampling rate for year and extrapolated over the life of the BDO HTF.
Calculating how frequently a BDO HTF should be sampled
Findings indicated that non-branded BDO HTFs had an additional operating cost over the life span of the fluid. However, this data was reanalyzed to compare the percentage degradation (1 to 9 percent; see Table 1) and from this the time between degradation points could be extracted. This offers new insights into the sampling of BDO HTFs, irrespective of whether they are non-branded or branded. It also helps manufacturers define the frequency that a BDO HTF should be sampled in terms of fluid type and degradation state of the fluid as well as the potential importance of condition-based monitoring with regard to reducing the overall sampling frequency and subsequently, the plant’s operating costs.
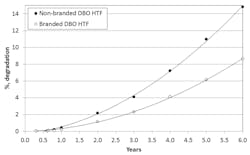
Figure 1. Degradation concentration in a trough CSP plant over time with no degradation removal. Note: The above figure was adapted from source 3.
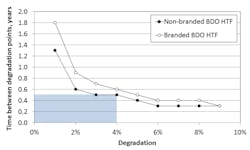
That the condition of an HTF needs to be routinely monitored is rarely debated (i.e., sampled and then chemically analyzed to assess its condition)5. General guidance for all HTFs says that an HTF should be sampled once per year if it is operating at bulk temperature. Lang and Lee3 sampled data from BDO HTFs used in CSP plants. In Figure 1, extracted from3, year is plotted against percentage degradation to give degradation rate, assuming no degradation byproducts are removed from the CSP system during normal operation. For each of the percentage degradation points, the corresponding time point was calculated. For example, it took non-branded and branded BDO HTFs, respectively, 1.3 and 1.8 years to go from 0 to 1 percent degradation. This was repeated for each percentage from 1 to 9 percent so that BDO HTFs could be compared. From the percentage points plotted it is possible to calculate the time between points, which is plotted in Figure 2. The mean time between samples was calculated as 0.5 (6 months) and 0.67 years (8 months) for non-branded and branded BDO HTFs, respectively, and is a direct indication of how frequently non-branded and branded BDO solar HTFs should be sampled in real life.
Sampling frequency during a BDO HTF lifetime
From Figure 2 it is also possible to divide the data based on percentage degradation. Choosing an arbitrary value of 4 percent degradation, it is clear that the time between points is slightly longer when degradation is less than 4 percent (8.7 versus 12.0 months for non-branded and branded BDO HTFs, respectively) and shorter when degradation is greater than 4 percent (3.8 versus 4.8 months for non-branded and branded BDO HTFs, respectively). Figure 2 also shows there is no difference between the sampling frequencies for the two fluids when degradation reaches 4 percent.
Figure 2. Plot of percentage degradation against the time between percentage degradation plots. Note: the blue shaded areas represents the 4 percent degradation level and the accompanying time between degradation plots presented in Figure 1.
Total number of samples over the life of an HTF
Using the data plotted in Figure 2, the annual sampling frequency was estimated and presented in Table 1. Sampling frequency was calculated on a per annum basis by dividing 12 months by the time between degradation plots in Figure 2. Samples per annum were then multiplied by 25 years to give the total samples over the life of the HTF. These calculations were performed for both BDO HTFs. Table 1 shows that non-branded BDO HTFs need to be sampled up to 1.4 times more often than branded BDO HTFs. Furthermore, over the life of the BDO HTF, the total number of samples was calculated to be 83.3. Interestingly, the total number of samples can be halved by keeping degradation between 2 and 4 percent (non-branded and branded BDO HTF, respectively). This highlights the importance of using degradation to guide sampling frequency and the potential savings from adopting this approach.
Conclusions
The current analysis is new and extremely important to sampling of BDO HTFs. The main findings showed:
- That the sampling frequency of BDO HTFs is important in guiding customers on sampling regimes for virgin and used BDO HTFs.
- The benefit of condition-based HTF monitoring in terms of limiting percentage degradation. Increasing percentage degradation increases the yearly sampling rate and total samples needed over the life of a BDO HTF.
- The benefit of condition-based HTF monitoring in terms of a tool whereby cost savings can be made by the customer. Indeed, maintaining lower percentage degradation means fewer samples (per year and over the life of the BDO HTF), which will cost the customer less over the life of a BDO HTF. In the latter case, this also means a healthier HTF that has benefits regarding sustained operation and reduced wear on the system [6].
Author’s note: The author would like to acknowledge the writing support provided by Red Pharm communications, which is part of the Red Pharm company (Visit @RedPharmCo on Twitter).
References
- Wagner O Walter. Heat transfer technique with organic media. In: Heat transfer media, second ed. Graefelfing, Germany: Maria-Eich-Straβe; 1997. p. 4–58 [Chapter 2].
- Vignarooban K, Xu X, Arvay A, Hsu K, Kannan AM. Heat transfer fluids for concentrating solar power systems – A review. Applied Energy 2015: 146; 383-396.
- Lang C, Lee B. Heat transfer fluid life time analysis of diphenyl oxide/biphenyl grades for concentrated solar power plants. International Conference on Concentrating Solar Power and Chemical Energy Systems, SolarPACES 2014. Energy Procedia 2015: 69; 672 – 680.
- Wright C. Case study in CSP plant performance. Renewable Energy Focus 2015: 16 (2); 22-26.
- Wright CI, Picot E, Bembridge T. The relationship between the condition of a mineral-based heat transfer fluid and the frequency that it is sampled and chemically analysed. Applied Thermal Engineering 2015: 75; 918–922.
- Tian Y, Zhao CY. A review of solar collectors and thermal energy storage in solar thermal applications. Applied Energy 2013; 104: 538–5.
Please contact the author for reference materials cited in this article.
Chris Wright is a research scientist, graduating from the University of Leeds in the UK with a BSc and Ph.D. He can be contacted at [email protected].


