Traditional terminology and presentation of pump curves can lead to poor decision making. In this case, let’s focus on the “efficiency curves” included as a key measure in standard pump curves today. These curves do in fact report efficiencies of the pump and show the desired “Best Efficiency Point,” and improving efficiency is a noble and necessary goal, particularly given the heightened focus on energy consumption in recent years. The problem, however, is that “efficiency” may be the most trivial information that these curves can convey. To label these as “efficiency,” and to show numbers that decrease slightly as one moves away from the optimum, do make improvement in this area a desirable, but let’s be honest, hardly an urgent or critical outcome. In addition, making a case that we should get to the best efficiency point, and showing that the decrease is relatively minor, makes it sound even less dire.
All of us who read these efficiency curves — engineers, operators, purchasing agents, accountants, supervisors, and others — have items in our own homes that we know are not “the best” in terms of efficiency. We have a furnace that we’ve had for many years that does not have “the best” efficiency available, and yet we have not made the change. All of us have heard from salesmen, who have numbers to show us that new windows would “pay for themselves” in energy savings, but we still haven’t replaced our windows. The promise of lower utility bills in the future has not been enough motivation to write that check and do everything else that goes along with the decision. Maybe we could save some more energy if we’d monitor our tire pressure or clean those coils on the refrigerator. It would be a bit of a hassle to make these changes though, and while we know it would be better in some ways, we don’t make the commitment and just don’t get around to it.
Chasing Efficiency Points
Let’s look at our pump curves then and our language around those. Can we really convince an operator to take an active role in system operation to improve the mechanical efficiency of just one component in a system to gain just a couple percentage points on mechanical efficiency? This would require him to monitor pressures or levels and then adjust a control valve or introduce a process gas to a draining tank. If we have proper gauges and if we actively read them and if that engineering theory is right and if I’m able to do it, then the pump can run at 68 percent efficiency instead of 66 percent. Sounds like way too much trouble for such a small impact.
In addition to the operator, let’s consider the role of the maintenance department in keeping a pump running at BEP. One example is the case of a seasonal adjustment in demand that could be accommodated by a smaller impeller. Are they properly motivated to make the change? Even after we buy a pump with a back-pullout option, for example, can we really convince maintenance to change that impeller when it appears that the driving force to do so is to have 84 percent efficiency instead of 81 percent? I think they have more pressing matters and would prefer to just let the pump “take it easy” during the slow season.
Beyond the shop floor with its operators and maintenance staff, what is the effect of labeling the efficiency curves in the purchasing department? Are they really going to approve the extra investment required to purchase a double-volute pump, for example, when they’re told that it gets us a certain percentage of efficiency? Money today may be too tight for the payback offered by the relatively small change in energy savings, and the financial folks can find better returns elsewhere for the limited cash available for investment in today’s tight economy.
Telling the Real Story
Words mean things. Pump curves speak to people. In their most common form currently, they imply that the reason to take an active role as an operator, for example, is to chase a few percentage points in efficiency. While most would not vocalize it in today’s more energy-conscious world, a natural tendency would be to consider this a very low item on the list of pressing matters they face. Therefore people won’t speak out against it, but they also won’t make it an actual priority in practice.
If the change in mechanical efficiency of the pump is relatively trivial, as I suggest, then what is the real impact of operating a pump at a point other than BEP?
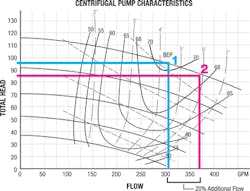
For this article let’s consider a typical 3x4x10 pump running with a four-pole motor. We’ll consider it operating at two different conditions. We’ll look at it operating at BEP and compare that to a second condition in which it operates at just 20 percent more flow, commonly considered within an acceptable operating range for most applications.
Since efficiency curves imply that their main emphasis is on energy consumption, let’s first consider the actual effect on energy consumption of moving around on the pump curve. BEP shows the optimum point for running the pump, and the pump curves for our pump would move from 70 percent efficiency down to about 68 percent efficient. What is less obvious is that the increased flow requires more horsepower to drive the pump. In our example, when a recirculation pump is allowed to run off of the BEP for any reason then, the loss is not the 2 percent reflected in the decreased efficiency, but more than 10 percent! This results from:
BHP pump = Head added to fluid x Fluid specific weight x Volumetric flowrate/Pump efficiency
The fact that the pump moved from 70 percent to 68 percent efficient is an almost negligible part of the calculation. Perhaps even more important is the fact that at the second point, the pump is delivering almost 10 percent less head and differential pressure while consuming more than 10 percent more power, a fact that may interfere with the real purpose of the pump in the first place. When these considerations are made apparent, it may be more convincing that the pump should be run at BEP, and it may justify active adjustment by an operator or a modification to the system by an engineer or changing the impeller by maintenance.
So the readers of efficiency curves can easily underestimate their impact with regard to energy consumption, but what other information could be even more critical with regard to BEP and these iso-efficiency curves? Let’s consider pump life for the two operating points in our example. What happens when we miss the “best efficiency” point, even by this relatively small amount? You’ll see that it’s not just that we aren’t “the best” and not just that we aren’t “efficient” with regard to energy consumption.
Pumps are taken out of service for a wide range of failures, but one of the most common sources of lower MTBF is bearing failure, even if the symptom is something else like seal failure or excessive vibration. Designers of equipment, such as pumps, specify bearings based on a load/life relationship that is published by bearing manufacturers. The pump in our example has ball bearings and that relationship is:
Life in application = Design Life (Design load/Load in application)3
Providing this load/life equation means that bearing manufacturers do not predict the life of the bearing in your application, but rather they acknowledge that the life in your application depends, and depends heavily, on the load in your application. An increase or decrease in the load in an application will result in a cubic change in the life of that bearing. Since bearing load is so critical to life then, we need to consider pump bearing load. The BEP is NOT just the point of best efficiency, but rather the operating condition that results in equilibrium, that is, a balancing of the internal forces, and therefore the lowest radial forces on the bearings. Moving away from BEP causes an increase in those bearing loads according to:
Fr = Kr x (H S/2.31) D2 B2
The factor Kr is derived from specific speed and percentage of design flow, and like bearing life, is also not a linear phenomenon. In our case, for example, when the pump is run at the second condition rather than at BEP, the resulting radial force generated at the impeller increases by 140 percent! This significant increase in force will decrease the life of the bearings in our pump by 93 percent! This means that the bearings will likely fail after only 7 percent of the design life of the pump, a significant degradation that should be a well-understood consequence of running the pump away from its BEP.
Again, bearing manufacturers allow the downstream users of their products to make a decision about the life of their products, based on the loads they expose them to. Pump manufacturers similarly produce pumps with a specific design life, and then each application – the way that a pump is specified, integrated into a system, and then operated – determines what percentage of that design life will ultimately be achieved.
The equations and printed data show that moving along a pump curve in this specific example, to a point just two efficiency points lower than BEP actually causes an increase of 10 percent in power costs and a 90 percent reduction in pump life. Is this really what happens in these cases? Would real life actually match this theory? The answer is NO, it would not. What actually happens would be worse, and possibly dramatically worse!
Other Factors to Consider
This introductory article looks at only two parameters, when actually many more are involved. To fully analyze this we would have to consider many more variables, such as:
-
Shaft stresses. Stresses in shafts are significantly increased with respect to load when a pump moves away from BEP. Consider fatigue alone. A designer may well intend to keep the stress in a shaft below the endurance limit for that material, meaning that it could theoretically handle an infinite number of cycles at that stress. It may well be that the increase in radial load results in a stress above that level, in which case the shaft begins a countdown to premature, yet completely predictable, failure.
-
Clearances. An assembly view of the pump shows very tight clearances in an unloaded state that are critical not only to the desired performance characteristics of the pump, but also its life. Consider the pump in our example running in its second condition with its significantly increase radial load. This load results in deflection of the shaft, and hence changes in those clearances and therefore the performance of the pump. At some point, the additional load actually results in an interference condition rather than clearance, and very early failure of the pump, even more likely in a pump with the largest impeller and a sleeved shaft.
-
Suction conditions. In this introductory article, I’ve also avoided the most likely and most commonly devastating phenomenon to a pump – cavitation. Running in our second condition at 120 percent of BEP, the additional flow would clearly result in both a drop in NPSH available and an increase in NPSH required. These levels could easily result in a crossing of the numbers, thus driving the pump into cavitation. Remember that NPSH available is dependent on friction losses in the suction line, a phenomenon that would increase by 44 percent in our example, since the relationship to flow is again not linear, but squared. Accompanying that drop in availability would be an increase in the required NPSH from 4.5 ft. to 5.8 ft., for an increase of almost 30 percent for our pump. In many applications, this would result in cavitation, a well-known destroyer of many pumps in the industry, and its effect would dwarf the effect from decreased bearing life delineated above.
-
Seals. These components are intended to run in a certain design environment. Introducing them to effects from increased forces, deflection, vibration, and temperatures will degrade their intended design life as well, requiring replacement before the mating surfaces are actually worn through normal use.
A New Way of Seeing Best Efficiency
Based on the above, it is clear that BEP and accompanying efficiency curves are not intuitive predictors of actual energy consumption, significantly understating the actual effect of running off of the BEP in our example. Beyond the issues of energy consumption, one real problem is the all-too-common misinterpretation that moving along the pump curve simply results in a few percentage points swing in the mechanical efficiency of the pump, rather than the internal loads and fluid behavior. In this simple example we’ve quantified just a couple of the effects of running a pump away from its BEP and included a bit of narrative regarding other detrimental effects not detailed here. We’ve shown that those involved in pumping systems who do not quantify the magnitude of these effects and consider them carefully could easily be misled by the labels on the efficiency curves.
So what? Is this just another article that either lays out the theory or bemoans the practice? Not at all. Nothing in this article is new knowledge or breaking research for pump manufacturers, nor does it begin to address the myriad of challenging and sometimes competing realities that users must face in their daily operations. This article is simply intended to use a bit of engineering analysis coupled with what we know happens in the field, and suggests potential improvements.
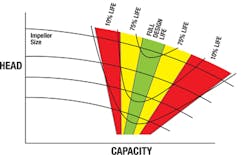
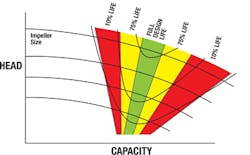
Labeling curves as “efficiency” and showing a slight decrease in mechanical efficiency is not getting the results that industry needs. Curves could be altered and zones could be established and shown for pump life. Each pump curve could have the zone for “design life” at BEP, and then a zone next to that for “75 percent life” and then for “50 percent life” and then one for “10% life.” Pump manufacturers could provide this as an alternative to efficiency curves, or reliability engineers could estimate this for existing applications in their facilities based on general engineering principles. These could be posted and used for control systems and protocols. Remember too, the pump curve is inadequate unless coupled with a system curve, since the operating point is the intersection between these two curves.
What would be the effect of posting these “Life” or “Reliability” curves, or whatever they might come to be called, in your facility? Is it possible that they would get more attention than the current efficiency curves? Given these predictive zones, users could monitor time spent in each zone and effectively predict pump life and know that time spent outside of the current “BEP” zone represents a tradeoff in pump life, and those tradeoffs could be considered on a cost-benefit basis. There could be other concrete changes like an increase in specifying double-volute pumps because their inherently broader life curves would be readily apparent. This quantification of the relationship between life and operating condition would make the trouble spots clear, and it would become clear that poor life is not directly tied to our bigger pumps, or pumps with more corrosive or abrasive fluid. It is not a matter of older or newer pumps, or a function of how skilled our mechanics are. It would be more evident that a large contributor to pump life is its operating conditions, and what those are relative to its BEP. This approach could also change the way that reliability engineers invest their time. Why be surprised some time down the road when we put a vibration analyzer on the pump and see that the pump has degraded and will need to be changed prematurely? Instead we can easily, based on where the pump has run on the curve, predict the rate at which we are burning through the life of the pump – consuming its bearings for example. Reliability engineers may alter their methods to employ proper gauging and monitoring of pump applications and work to get them closer to BEP for longer periods of time.
Is operating a pump at BEP really a big deal? YES! And way more so than would be implied by the term “best efficiency point,” which could even be renamed along with changing to terms that more accurately reflect the consequences of moving out along the pump curve, crossing the rather innocent-looking efficiency levels. Is it true that extensive life is obtained from an application that runs at or near its BEP? Don’t you have some pumps in your facility (and in your personal property) that seem to run forever? Check, and you’ll likely find that they run inside of their intended design parameters. Pumps spending much time out of control, on the other hand, likely need constant attention. There are other potential causes for significantly decreased pump life, such as improper specification, installation, or maintenance, but commonly the answer is right in the pump curves and the fact that these pumps spend too much of their duty cycle too far from BEP.
The current efficiency curves don’t tell us what we should know about pump life. Limiting operation to a certain number of curves from BEP, for example, won’t suffice. Nor will using a certain percentage drop in efficiency, since neither of these two measures directly correlate to pump life across the variety of pumps and applications. Further, the effect on life is non-linear and non-intuitive, and therefore must be calculated. In addition, even if life or reliability curves are developed, it is true that NO curve inherently tells the full story — such as the potential drawbacks inherent to a double-volute pump – but life or reliability curves would go a long way in improving pump applications throughout industry.
Let me go back to the case of bearings, since I’ve detailed their role in pump life above. Bearing manufacturers don’t provide, as their primary technical specification, the rolling resistance relative to load. They could, but they know that the effect is trivial relative to the effect that load has on the life of the bearing. They show, as their primary measures for their customers, the load/life relationship. Users of those bearings then can make a decision about the life in their specific application. Fluid handling industries would be well served to make pump life relationships readily available, even if it results in diminished reporting of mechanical efficiencies.
Energy savings are real, they can be significant, and reducing energy consumption is a wonderful goal for many reasons. The ASME’s new standard for energy assessments may draw even more attention and sound technical practice to this goal. I submit, however, that the impact on pump life is of even higher concern in most applications. The two goals are complementary anyway, but focusing on the dramatic effect on life may bring more urgency to the problem and saving energy would be a byproduct. The person who campaigns to run pumps at BEP can sound like a whiner. The quixotic coworker charging windmills for a few efficiency points does not garner much support. Getting to a slightly higher mechanical pump efficiency does not provide sufficient motivation for the sustained effort it takes to instrument a plant properly, ensure active intervention by operators, careful specification from engineers, proper installation from pipefitters, and all the others it takes to make this work. Moving to clearly articulated and explicit “Life Curves” would show pump life is not an uncontrollable “cost” or completely random and unpredictable phenomena, but rather is a “price” we pay as a result for decisions that we make that are within our control. Maybe a new name for BEP should follow the same well-established acronym. If we need to keep the BEP term due to legacy, maybe it could become “Balanced Equilibrium Point.” The general shape of the life curves would be the same, but would reflect the percentage of design life one could expect running at this condition, and of course an effort to maximize pump life would also, secondarily, maximize the pump’s mechanical efficiency.
Joe Untener is a professor of Mechanical Engineering Technology at the University of Dayton. A registered professional engineer, Joe has 25 years of engineering experience in industrial and educational settings, having worked not only for General Motors, but as a consultant in dozens of industrial plants throughout the United States. He is co-author of the 7th Edition of Applied Fluid Mechanics with Robert L. Mott, due out through Prentice-Hall in 2012. Mr. Untener can be reached at [email protected].
www.udayton.edu


