Between the wellhead and distribution, there are many measurement points for both oil and natural gas. These include measuring flow, temperature, and level at the separator, allocation metering for oils owned by more than one party, and measuring gas flow at the gathering stations, among others. Natural gas flow is measured as it enters and leaves the gas processing plant, and it is measured within the plant as well. Crude oil flow is measured as it arrives at the refinery and as it leaves the refinery. It is also measured numerous times within the refinery.
Once natural gas leaves the processing plant, it is measured at multiple locations on the way to its distribution points. In some cases natural gas travels thousands of miles before being measured in a custody-transfer application as ownership is transferred to a utility company. The utility company then distributes the gas to commercial, industrial and residential customers.
Refined oil leaving a refinery is likely to leave either by truck, railcar, or by pipeline. This is a custody-transfer measurement. It is then, in many cases, transferred to a ship, plane, railcar, or truck for further distribution. This is also a custody-transfer measurement. Once the oil reaches its destination via these different modes of transportation, it undergoes a custodytransfer measurement again. From this point, it travels to its final point-of-use, which could be a commercial or industrial facility or a residential location. Even this last portion of the journey is complex, since refined fuels are sold by stores, fuel delivery services, gasoline stations, and other similar outlets.
The Global Economy
Flow Research just completed an 18-month study of the oil markets. Much of the attention was focused on the following critical aspects of the oil markets:
- Crude Oil Production
- Crude Oil Reserves
- Crude Oil Imports
- Crude Oil Exports
- Refined Petroleum Imports
- Refined Petroleum Exports
- Refined Petroleum Consumption
It is of course possible to look at any of the above variables in isolation, and it is also possible to look at them in relation to a single region or country. For example, someone might wonder what are the crude oil reserves of the U.S., or how much crude oil does China produce? This is both interesting and instructive, but it doesn’t begin to compare to the knowledge gained from looking at all these variables together on a worldwide basis.
RELATED: Flowmeters and The Role of Oil & Natural Gas
The Importance of a Global Perspective
When taking a global look at the oil markets, a number of facts stand out. These facts have geopolitical implications and explain much about the energy policies of the larger oilproducing countries:
- The Middle East is by far the most oil-rich region in the world.
- The U.S. consumes about twice as much crude oil as it produces.
- Like the U.S., China consumes about twice as much crude oil as it produces.
- In addition to the Middle East, Europe and North America are blessed with large amounts of crude oil.
- By contrast with other regions, Asia has relatively small amounts of oil.
- Japan is rich in coal, but has very little crude oil or natural gas.
- Most of Europe’s oil is located in Russia, Kazakhstan, Azerbaijan, and the North Sea countries, especially Norway.
- This is true of both crude oil production and crude oil reserves (All of Russia is classified with Europe).
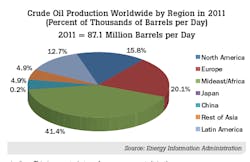
As the “Crude Oil Production Worldwide” chart shows, the Mideast/ Africa region produced over 40 percent of the world’s oil in 2011. It also shows that Mideast/Africa produced more oil in 2011 than North America and Europe combined, even though those two regions produced over 35 percent of the world’s oil. By contrast, Japan, China, and the rest of Asia produced only 10 percent of the world’s oil in 2011.
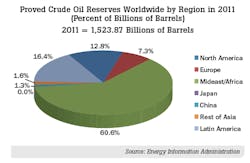
The contrast in the regions is even more striking when looking at crude oil reserves, as shown in the “Crude Oil Reserves Worldwide” chart. The Mideast/Africa region accounted for over 60 percent of the world’s crude oil reserves in 2011. By contrast, North America and Europe have only 20 percent of the world’s crude oil reserves. Latin America accounts for most of the rest, while Japan, China, and the rest of Asia contained less than 2 percent of the world’s oil reserves in 2011.
5 Main Sources of Energy
How do countries make up for their lack of crude oil?
Countries like the U.S. and China, which consume twice as
much crude oil as they produce, need to make it up in some
other way. They do it either by importing more oil or by supplementing
their produced oil with some other form of energy.
Since there are five main sources of energy, they use one of
the following five energy forms to meet their energy needs:
- Oil (Imported)
- Natural gas
- Coal
- Nuclear
- Renewables
While these are the five main sources of energy, some of these have many subtypes. For example, crude oil is refined into many types of refined fuels, including motor gasoline, heating oil, diesel, liquefied petroleum gases, kerosene, and other petroleum-based products. Natural gas is processed and refined into industrial gases such as helium, nitrogen, carbon dioxide, and other gases. It is also converted into liquefied natural gas (LNG) for transportation purposes. There are many types of renewables, including solar, wind, biomass, geothermal, and others.
For the most part, countries rely on the source of energy that is most freely available to them. While China does not have a lot of oil or natural gas, it does have rich coal resources. This is why China relies so heavily on coal for its energy needs, despite the environmental hazards. The same is true of Japan. So while China has only modest supplies of oil and natural gas, and Japan has virtually none, they fulfill a significant amount of their energy needs through coal they produce themselves.
What Is ‘Energy Independence’?
There is a strong movement towards using natural gas and renewables in the United States and other countries, such as Germany, to make up the “energy gap” that is currently filled by imported oil. Natural gas is cleaner and more plentiful than crude oil and can serve many of the same purposes as refined petroleum products. Renewables are much cleaner, but the research on renewables is still in its early phases, and most renewable forms of energy are still too expensive to be competitive with natural gas and oil.
Addressing Asia’s Need for Energy
As noted earlier, Japan, China, and the rest of Asia have a much smaller percentage of oil and natural gas than other regions of the world. These countries only produce about 10 percent of the crude oil worldwide, and they hold only about 3 percent of the world’s oil reserves. Yet they consume 30 percent of the world’s refined petroleum products. China is a case in point; in 2011 China produced 4.3 million barrels of oil per day, while consuming 8.9 million barrels per day of refined product. That same year, China imported 4.7 million barrels per day of crude oil.
When people talk about the Chinese demand for oil, they are talking about the gap between the amount of oil China produces and the amount of oil that country consumes. Like the U.S., China is forced to import oil to make up its “oil gap.” One way that China is responding to its “oil gap” is by partnering with companies in other regions of the world to achieve at least partial ownership of foreign oil fields. This enables the country to increase its production totals, while reducing its need to import crude oil produced solely by other companies.
The picture for natural gas is not much more favorable to Asia than the picture for oil. Japan, China, and the rest of Asia produce less than 13 percent of the world’s natural gas. And most of this is produced in other Asian countries, such as Indonesia, Malaysia and Australia. In terms of reserves, Japan, China, and the rest of Asia countries hold less than 10 percent of the world’s natural gas reserves. This deficit has led Japan to rely on nuclear power and China to rely on coal as energy resources.
One solution that has emerged for Asia’s energy needs is liquefied natural gas (LNG). Australia’s massive Gorgon project, located off the west coast of Australia, is designed to help fill the natural gas needs of many countries in the region, including India, with natural gas in the form of LNG. Built with an investment of $54 billion, this project is scheduled to go online in 2014. It includes several liquefaction plants for converting natural gas into LNG so that it can be more easily shipped to areas of need.
A second solution is the emergence of shale oil and shale gas. The U.S. is currently the leader in the production of shale gas, but other countries are catching up. The production of shale oil and shale gas is made possible through advanced drilling technologies, which are making formerly “dry” wells productive again. These technologies are also making it more difficult to classify oil and natural gas reserves, since to count as part of the reserves the oil and gas in a well must be “technically recoverable using current technologies.” As the technologies change, so does what counts as “technically recoverable.”
Implications for Instrumentation
The above discussion is of particular interest in the world of instrumentation, as crude oil and natural gas are both measured when they are produced and all along the distribution chain. They also are measured when they are imported and exported, and when they are delivered to their point-ofuse. Knowing what regions and countries are producing and exporting oil and natural gas should provide a guide to where instrumentation is needed today. And knowing where oil and gas reserves lie provides a guide to where instrumentation will be needed in the future.
Jesse Yoder, Ph.D., is president of Flow Research Inc. in Wakefield, Mass., a company he founded in 1998. He has 25 years of experience as an analyst and writer in process control. Dr. Yoder specializes in flowmeters and other field devices, including pressure and temperature products. Dr. Yoder can be reached at [email protected].
For more on Flow Research’s work in the area of oil markets and measurements, visit www.oilflows.com.


