For considering fluids, computational fluid dynamics (CFD) has been around for more than 40 years, encompassing a wide range of commercial and in-house 1-D, 2-D, and 3-D computer-aided engineering (CAE) simulation software available to engineers today. Throughout the past 15 years, engineers have made huge productivity gains from the use of CFD and CAD-embedded CAE tools and, in particular, 1-D systems simulation software as the software has matured. One of the most powerful aspects of using a 1-D simulation tool is its versatility and adaptability for use at any stage of a systems design process to explore options for improving the final design and reducing the cycle.
As more countries continue to use natural resources for their economic development, the need for finding economical and productive deposits of oil and gas has also been on the rise over the past decades. The world has witnessed a significant increase in the number of explorations for fossil fuels over the past 30 years, especially offshore with the help of technological advancement that makes tapping the reservoir under the deep sea economically viable.
While oil and gas have been produced offshore since the 1940s, the pumping out of the buried resources was mostly undertaken with fixed platforms that directly sat on the seabed. However, as the reservoir onshore and in the shallow waters depletes, drilling operators have gone deeper in search of energy sources since the 1970s, and thus the demand for floating production units (FPUs) capable of drilling down deep while floating on the water has increased.
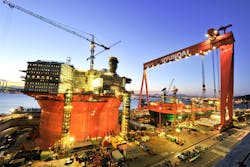
Four types of FPUs are built at Hyundai Heavy Industries (HHI), the world’s largest shipbuilder and an offshore facility contractor, including semisubmersible floating production systems (FPS), tension leg platforms (TLP) and spar platforms. Each type of FPU has unique features, but all the FPUs have to be able to handle sea water properly and reliably.
The challenge of designing systems for unpredictable situations
The various systems installed in FPUs are designed to use seawater for working fluid, cooling fluid and as feed for desalination for freshwater. This means the seawater system in FPUs should be designed for safe operation under a wide range of working conditions. While designing a seawater system for predictable pressures, temperatures and flow rates is a rather straightforward process, FPU operators often encounter unexpected situations such as a sudden rise in pressure on the system that might lead to malfunctions.
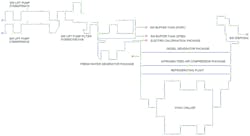
For the reliable analysis of the potential effects on the system under unpredictable situations, a detailed piping system was developed in-house at HHI using 1-D CFD system simulation software. The aim was to determine the maximum occasional force that the installed seawater system would experience at the specific spots under different operating conditions caused by pressure surge (see Figure 1). Then the measured forces could be compared with the maximum allowable forces for the pipes and fittings.
Figure 1. 1-D CFD model of the system. Graphic courtesy of Mentor Graphics
For the analysis, eight operation scenarios were tested:
- CASE 1-A: Closure of MOV-521 heating, ventilation and air conditioning) system valve when a seawater lift pump is running
- CASE 1-B: Closure of FV-501(minimum flow line) valve when a seawater lift pump is running
- CASE 2-A: Seawater lift pump starts when FV-501 and RF-501 are open
- CASE 2-B: Seawater lift pump starts when FV-501 is opened and RF-501 is closed
- CASE 2-C: Seawater lift pump starts when FV-501 and RF-501 are closed
- CASE 2-D: Two seawater lift pumps start when FV-501 and RF-501 are open
- CASE 3: Seawater lift pump starts when other pumps are running
- CASE 4: Seawater lift pump trips because of power failure
For each of these scenarios, a transient analysis using the CFD software was conducted to calculate the pressures the seawater system would undergo. As expected, the actions of opening or closing valves and starting or tripping pumps turned out to be the main sources for the increased pressure. The resulting maximum pressures were recorded at the 13 spots where malfunctions were most likely to occur.
The following boundary conditions were set:
| Type | Pressure (barg) | Description |
| Inlet | 0.0 | Seawater surface pressure |
| Outlet | 0.0 | Outlet of minimum flow line |
| Outlet | 3.0 | Inlet of hull bilge ejector |
| Outlet | 0.0 | Inlet of seawater buffer tanks (PORT/STBD) |
| Outlet | 4.0 | Inlet of freshwater generator packages |
| Outlet | 0.0 | Inlet of seawater disposal caisson |
The following were the fluid properties used in the analysis:
| No. | Properties | Value |
| 1 | Fluid | Seawater (30°F) |
| 2 | Density (kg/m3) | 1,023 |
| 3 | Viscosity (cP) | 0.822 |
| 4 | Vapor pressure (kPa) | 4.217 |
The following equation was used to calculate wave speed, and the table shows the wave speed calculated for the main line.
a = wave speed, ρ = fluid density, K = fluid bulk modulus, D = pipe internal diameter, E = pipe Young’s modulus, t = pipe wall thickness, ϕ = pipe constraint parameter (typically 1)
| Line Size (in.) | Piping Class | Ρ (kg/m3) | K (Gpa) | D (m) | t (mm) | E (Gpa) | Φ (m/s) |
| 10 | 45A | 1,023 | 232 | 0.263 | 8.1 | 26.5 | 768 |
| 12 | 30A | 1,023 | 232 | 0.313 | 5.5 | 123.2 | 1,046 |
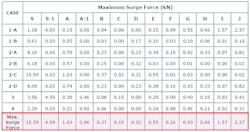
The values were then automatically extracted with the CFD tool using Visual Basic for Applications scripting in Microsoft Excel where the net force on each pipe section was calculated. The forces at each spot for each scenario were tabulated with the respective maximum force (see Figure 2). With this design, all of the occasional forces stemming from unpredicted pressure surges remained within the tolerance level. The ability to accurately calculate the surge pressures because of operational scenarios in the software was the key to be able to develop reliable early stage design.
Figure 2. In all the scenarios, the maximum surge force was under the design pressure of the pipeline. Graphic courtesy of Mentor Graphics
Before developing in-house, pressure surge analysis with CFD, HHI engineers were dependent on overseas engineering companies to perform preliminary surge calculation in the basic design phase. Pipe routing typically experiences a significant amount of design changes at the engineering stage. It requires reanalysis of pressure surge for the proper calculation of pipe support strength. However, because the team had to rely on the other engineering firms, HHI engineers often experienced difficulties in seeing design changes in real time and thus had to reconstruct the piping because of unexpected and excessive surge forces.
With the new analysis method using the CFD software, engineers can conduct detailed engineering and calculations for piping simultaneously and they can design more reliable seawater systems. In addition to pressure analysis, they can independently analyze flow assurance, holistic dynamic simulations and depressuring simulations.
Park Sang-min is senior researcher, Choi Hoon is lead researcher, and Byun Woo-young is lead process engineer at Hyundai Heavy Industries.
