Excessive vibration can cause damage to a control valve, measurement equipment and the piping system. Plants often try to fix problems by measuring vibration, moving equipment, stiffening the valve structure, rewelding broken pipes, changing the piping system and other remedies — only to find problems still exist.
This is because it is often difficult to find the source of the vibration, which can originate not only with the control valve, but also with upstream and downstream piping and equipment.
This article will discuss modern techniques to help monitor, predict and solve problems caused by vibration in the vicinity of control valves.
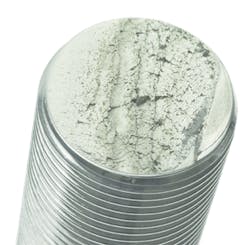
Figure 1. Control valve vibration caused this valve stem to break.
Vibration sources
Vibration experienced in control valve installations can be caused by pump cavitation, flow pulsation, flow-induced excitations, vortex shedding, rapid valve closure, vapor pocket collapse, pump startup and shutdown, slug flow, water hammer and many other hard-to-diagnose conditions.
For example, the valve plug can vibrate and cause damage to the cage, or it can cause a fatigue failure such as the stem breaking where it is connected to the plug. The results of the cage damage can be higher friction and thus poor valve assembly performance. If the valve stem breaks, the valve ceases to function.
In some cases, valves and piping can shake so badly that workers are afraid to go near the system for fear the piping will burst. In other cases, the valve noise generated is excessive.
Two common types of vibration are associated with control valve installations. Acoustically induced vibration (AIV) generates excessive levels of high-frequency acoustic energy that can cause fatigue failure of welded downstream connectors. This is often seen in liquid natural gas emergency blowdown systems, but is also found in other process piping systems. The noise levels generated by the valve and other piping elements are high enough to cause damaging vibration to the piping system.
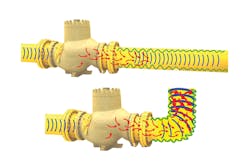
Flow-induced vibration (FIV) generates high levels of kinetic energy that can cause piping vibration, loosen piping supports and cause fatigue failure at piping branches (see Figure 2).
Excessive vibration can damage a control valve’s accessories, such as mounting brackets, actuator tubing, transmitters and actuators. Actuator tubing can suffer fatigue failures at or near the nut/ferrule location, causing pressure to be lost in the tubing. Without pressure in the tubing, the actuator cannot be controlled and/or pressure signals between control components are lost. In either case, the valve ceases to function as designed.
Vibration can also cause fatigue failures in nearby measurement components, such as pressure or temperature instruments installed in the downstream or upstream piping. This vibration can damage an instrument or degrade the instrument’s connection to the piping. Damage to an instrument can result in loss of the measurement signal, and failure of the connection to the piping can cause leaks.
Vibration can cause fatigue failure in piping, especially at welds and branch locations. At the very least, vibration is annoying because of the noise generated. At worst, vibration can destroy piping, cause leaks and prevent the valve from controlling a process. In either case, one of the most difficult problems is determining what causes the vibration.
Figure 2. Flow-induced vibration and acoustic-induced vibration can break welds, loosen piping supports, cause fatigue problems and shut down a process.
Measuring vibration
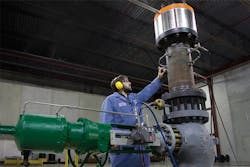
Vibration is measured with accelerometers placed at various points on the valve and actuator assembly, and upstream and downstream of the valve. While vibration can be measured with handheld devices, the preferred solution is to use wireless, battery-powered accelerometers (see Figure 3).
Older vibration sensors commonly used to find problems in motors, pumps and other rotating equipment that may not be suitable for diagnosing valve vibration. These vibration sensors often operate in the low-frequency range of 1,000 hertz (Hz) or less, while control valve AIV can reach levels of 3 to 5 kilohertz and even higher.
Vibration sensors are installed for two basic reasons: First, to measure the vibration in and around the valve and assess its severity in various locations; second, to assess changes and reductions in vibration after corrective measures are taken.
In most cases, sensors are mounted on the valve bonnet, stem connector, actuator, and/or inlet and outlet piping. If specific damage or high vibration occurs in one area, a sensor is typically mounted near the area of interest. In the case of a hot system, such as a steam line, sensors have a mounting to isolate the sensing element from the high temperature.
Sensor placement may also be dictated by acoustic measurements that identify high noise sources. To determine if the noise source is upstream of the valve — with noise then propagating through the system — sensors can be mounted upstream and downstream of the valves, and on the valve stem.
If the highest vibration levels are found next to a valve, the source or cause of the noise is most likely the valve trim components.
If the highest vibration is downstream, the problem may be closely coupled systems, where valves are too close to elbows and other equipment, causing flow-induced turbulence. Piping systems are sometimes designed with an elbow or tee near the valve inlet. Unfortunately, this provides a turbulent flow into the valve, which can result in more vibration than typical in the valve and additional turbulence in the piping downstream of the valve, causing excess vibration.
Similarly, the piping may be designed where an elbow or tee is placed directly downstream of the valve. The flow from the valve outlet can interact with the piping element, causing high turbulence and vibration. Both situations can be solved by moving piping elements farther upstream or downstream of the valve. In general, it is best to keep elbows at least 20 diameters before and 6 diameters after a valve.
A modern wireless vibration sensor provides complete vibration data including overall levels, energy bands, high resolution spectra and waveforms. Some sensors can measure vibration up to 20,000 Hz and transmit the measured vibration data over a wireless network to the plant’s control and monitoring system or PC-based software for analysis. If desired, the PC can upload data to the cloud where it can be accessed from any location with internet access.
One advantage of such a system is that it will acquire data at a set interval, such as every minute or every few hours. This allows vibration to be measured often over a period of several days, weeks or months. These vibration measurements can then be trended to reveal patterns leading to failure, allowing corrective action to be taken beforehand.
Manual systems are handheld and require an operator present to make the measurement, so these measurements are typically made much less frequently, often only when vibration is high.
Other useful data for analyzing vibration issues includes:
- Acoustic readings from sound
- Measurement sensors
- Process variable measurements of flow, pressure and temperature
- General data related to adjacent equipment and its operation
- Indications that blowoff or relief valves have opened or closed
- Control system actions such as opening and closing valves, starting and stopping pumps, or other actions to control a process
By analyzing vibration data and looking for correlations between vibration and changing process conditions, engineers can identify the root cause of the vibration.
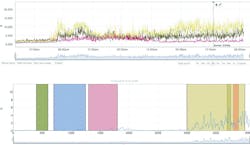
Figure 4. A plot of vibration and sound level over time, when compared with process changes — such as opening and closing a valve — can identify the source of excessive vibration.
Analyzing the data
Data from the vibration sensors can be sent to a process plant’s control and monitoring system, but analysis can be difficult because it often requires a high level of expertise, along with specialized training and tools, to extract usable information from the data.
Computational fluid dynamics (CFD) is a software tool used to predict fluid behavior. CFD cannot predict the acoustic field in the piping system at AIV frequencies. While these software programs may offer the option to perform predictive maintenance, the results typically compare poorly to the actual acoustic field as measured by sensors.
A better solution than CFD or analysis by operators viewing control and monitoring system screens is specialty analysis software, which cuts through the complexity of vibration analysis to provide a simple, reliable indication of equipment health via a single trend. One such software filters out traditional vibration signals to focus on impacting, a better indicator of overall asset health. Using the software, vibration data is analyzed for frequencies, amplitudes of displacement, velocity and acceleration, and characteristics of the vibration and changes in the vibration over time.
For example, the software looks for peaks in the frequency spectrum. Peaks are indications of resonance in the response of a system that is excited, or the excitation being generated at a tone.
An example of the excitation being generated at tones, a compressor will likely create a signal at a set of frequencies, so response at those frequencies indicates response to the input. If the excitation is turbulence, and a peak in the measured vibration is present, that would be an indication of a resonance. If the vibration is broad, it is an indication of an area of strong turbulence in the flow. Mitigation actions are different depending on the type of excitation and response, so it is important to identify problems precisely.
If vibration levels increase over time, this indicates a change in the system. Plant personnel can use this information to explore changes in process settings to reduce vibration to an acceptable level. They may also be able to identify high vibration levels for a set of process conditions and limit the time the process runs with settings causing these conditions.
An increase in vibration can also indicate an imminent or present structural failure. The software combined with knowledge of the system can reveal these types of failures and distinguish them from other failure modes (see Figure 4).
Plots of vibration intensities and sound level over time for the sensors in Figure 1 showed sudden amplitude increases associated with process changes.
In another case, when investigating the reason for damage to actuator tubing, analysis showed a direct correlation between a calculated indicator and process pressure. When the indicator reached a maximum value, the tubing failed.
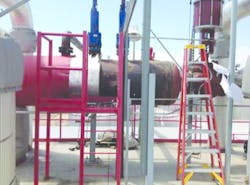
Figure 5. Emerson installed wireless vibration sensors on this steam let-down system to analyze the causes of vibration that were causing crack failures.
Solving a steam let-down system vibration problem
An ethanol plant in Minnesota had been plagued by vibration problems for years in a steam let-down system (see Figure 5) that affected the valve, piping, diffuser and steam header. The let-down system reduced steam pressure from 125 psig to 12 to 14 psig, prior to flow into a steam diffuser.
Specific problems included repeated weld and component failures on or around the steam diffuser that were plaguing the plant and causing unplanned downtime. Repairs to the diffuser cost $70,000, valve repairs cost $28,000 and installing steam separators cost $60,000. And every time the system had to be shut down for repairs, it cost the company $100,000 in lost production.
The plant changed the diffuser, tried different materials, moved the valve farther away from the diffuser, and called in consultants. Nothing worked. Independent vibration analyses indicated high vibration levels but did not identify causes.
Although the valve was not a Fisher valve, Emerson sent in engineers to measure vibration and analyze the problem. They installed wireless vibration sensors upstream and downstream of the valve, and on the valve and actuator. Correlating vibration data, operational information and historian data showed that the problem was not being caused by the valve, but was instead directly related to process changes.
Specifically, the diffuser was oversized, which caused excessive pressure drops. This correlation was found by examining the data from the vibration sensors and operating data from the diffuser.
Summary
Excessive vibration can damage valves, actuators and piping. Although sensors can measure vibration, locating the root cause of problems can be difficult. What is needed in many cases is specialty software to analyze the vibration, process data and extensive domain expertise to correlate vibration data with process conditions. If this expertise is not available in-house, external experts can often provide the required assistance.
Julian Mann is a principal engineer at Emerson for its flow controls products. He holds a Bachelor of Science in engineering science from Iowa State University and a Ph.D. in acoustics from Penn State. Prior to working at Emerson, Mann was an associate professor and assistant dean at Iowa State.
Shawn Anderson is an engineering specialist at Emerson. He has a Bachelor of Science in mechanical engineering from Milwaukee School of Engineering. Anderson leads a team focused on next-generation diagnostics, prognostics and controls for its flow controls products.
