Horizontally drilled oil wells among highest-producing wells
Graphic courtesy of the EIA
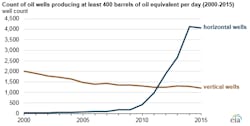
Oil wells drilled horizontally through hydrocarbon-bearing formations are often among the most prolific oil wells in the U.S. Although modern horizontal drilling achieved commercial success in the 1980s, drilling techniques have improved, and in recent years, horizontal drilling has become more common.
Geologic formations are almost always much greater in horizontal extent than they are in vertical thickness. For this reason, more oil-bearing rock is exposed for production in horizontal drilling than in vertical drilling. Horizontal wells are often completed in combination with hydraulic fracturing to maximize production along the exposed rock formation.
In 2015 nearly 77 percent of the most productive U.S. oil wells, or those producing more than 400 barrels of oil equivalent (BOE) per day, were horizontally drilled wells. For about 85,000 moderate rate wells producing in 2015, defined here as more than 15 BOE per day and up to 400 BOE per day, 42 percent were drilled horizontally. Of the approximately 370,000 lowest-rate, marginal oil wells in 2015, also known as stripper wells, only about 2 percent were horizontal wells.
EIA forecasts $51 per barrel 2017 Brent crude oil price
The U.S. Energy Information Administration‘s (EIA) Short-Term Energy Outlook (STEO) released on November 8 forecasts that North Sea Brent crude oil prices will average $43 per barrel (b) in 2016 and $51/b in 2017. The EIA expects West Texas Intermediate (WTI) prices will average $43/b in 2016 and $50/b in 2017.
The values of futures and options contracts indicate significant uncertainty in the price outlook, with NYMEX contract values for February 2017 delivery traded during the five-day period ending November 3 suggesting that a range from $35/b to $66/b encompasses the market expectation of WTI prices in February 2017 with 95 percent confidence. The 95 percent confidence interval for market expectations widens over time, with lower and upper limits of $27/b and $96/b for prices in December 2017.
Graphic courtesy of the EIA
2016 injection season sees record natural gas demand for week of Nov. 3
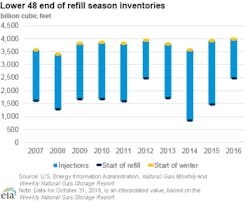
Total natural gas demand in the Lower 48 states reached record levels during the 2016 injection season (April through October). According to data from PointLogic, natural gas consumption and net exports averaged 71.4 billion cubic feet per day (Bcf/d)—2.2 Bcf/d above the 2015 injection season, which held the previous record. However, the total supply of natural gas decreased by an average of 1.1 Bcf/d compared to the 2015 injection season, according to PointLogic. Several factors contributed to the narrowing of supply and demand over this period including a rise in natural gas use for electricity generation, the opening of Sabine Pass, the first liquefied natural gas export terminal in the Lower 48 states, and lower natural gas prices lessoning the incentive to produce natural gas.
EIA forecasts electricity, coal, renewables and emissions in report
The EIA forecasts total U.S. generation of electricity from utility-scale plants will be 11.2 terawatt hours in 2016, up 0.2 percent from 2015. Total utility-scale generation grows by 0.5 percent in 2017.
The EIA expects the share of U.S. total utility-scale electricity generation from natural gas will average 34 percent this year, and the share from coal will average 30 percent. Last year, both fuels supplied about 33 percent of total U.S. electricity generation. In 2017, natural gas and coal are forecast to generate about 33 and 31 percent of electricity, respectively, as natural gas prices are forecast to increase. Nonhydropower renewables are forecast to generate 8 percent of electricity generation in 2016 and 9 percent in 2017. Generation shares of nuclear and hydropower are forecast to be relatively unchanged from 2016 to 2017.
Coal production in October 2016 was 73 million short tons (MMst), the highest monthly production level since October 2015, when it was 76 MMst. Forecast coal production declines by 150 MMst (17 percent) in 2016 to 747 MMst, which would be the lowest level of coal production since 1978. Forecast coal production increases by 3 percent in 2017.
Electric power sector coal stockpiles decreased to 163 MMst in August 2016, down 5 percent from the previous month. Although coal stocks are at their lowest levels of the year because of the typical seasonal decline that occurs each summer, they are still 4 percent above the August 2015 level, when coal stockpiles were 157 MMst.
Wind energy capacity at the end of 2015 was 72 gigawatts (GW). EIA expects that 8 GW of capacity will be added in 2016 and 9 GW in 2017. These additions would bring total wind capacity to 89 GW by the end of 2017.
After declining by 2.7 percent in 2015, energy-related carbon dioxide (CO2) emissions in the first six months of 2016 were the lowest for that period since 1991. For all of 2016, emissions are projected to decline by 1.5 percent, and then increase by 0.7 percent in 2017. Energy-related CO2 emissions are sensitive to changes in weather, economic growth, and energy prices.
Stable oil prices, improving credit conditions contribute to rise in mergers & acquisitions
Exploration and production (E&P) companies are increasing merger and acquisition (M&A) spending in the U.S. as stable crude oil prices and improved credit conditions in recent months allowed some companies to purchase assets or entire companies. The increase in M&A spending also suggests improved investor sentiment in the oil industry. The deals are concentrated in the Permian region of the United States, the area where the most drilling rigs have been deployed recently. The Permian is also the only onshore area where production is expected to increase in the next few months.
Graphic courtesy of the EIA
Low tanker rates enabling long-distance crude oil and petroleum product trade
Shipments of crude oil and petroleum products using marine tankers support an integrated global market for crude oil and petroleum products. Recent expansion of the global tanker fleet has resulted in falling or lower tanker rates for much of 2016 that have widened the geographic scope for economically attractive trade at a time when inventories of both crude oil and petroleum products are at high levels.


