Natural gas combined-cycle plants exceeded coal plants last year
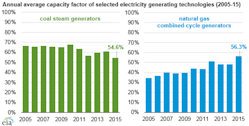
For the first time on record, in 2015 the average capacity factor of natural gas combined-cycle plants exceeded that of coal steam plants. The power industry has been running natural gas combined-cycle generating units at much higher rates than just 10 years ago, and the utilization of the capacity at coal steam power plants has declined.
The capacity factor of the U.S. natural gas combined-cycle fleet averaged 56 percent in 2015, compared with 55 percent for coal steam power plants, according to the U.S. Energy Information Administration (EIA).
Over the last few years, the mix of energy sources used in U.S. electricity generation has changed significantly. This change is particularly evident in the shift from the use of coal to natural gas for power generation. The industry has been building new natural gas capacity and retiring coal plants, but another important factor behind the changing generation mix is the day-to-day pattern of how existing power plants are used.
Keystone pipeline leak in South Dakota
Because of an oil spill, a key section of the Keystone pipeline in South Dakota has been shut down, according to TransCanada and CNN Money.
TransCanada operates the pipeline and reported a spill of about 187 gallons of crude oil to the Coast Guard’s National Response Center. The company said it is removing the oil and investigating the source. TransCanada said “no significant impact to the environment has been observed.”
The Department of Transportation’s Pipeline and Hazardous Materials Administration is “actively investigating” the incident and has deployed an inspector to the site to determine the cause of the leak.
Decline in cost of U.S. oil and gas wells since 2012
To try to increase understanding of the costs of upstream drilling and production activity, the EIA commissioned IHS Global Inc. (IHS) to study these costs on a per-well basis in the Eagle Ford, Bakken, Marcellus and Permian regions, analyzing the Permian’s Midland and Delaware basins separately. Upstream costs in 2015 were 25 to 30 percent below their 2012 levels, when per-well costs were at their highest point over the past decade.
Changes in technology have affected drilling efficiency and completion, supporting higher productivity per well and lowering costs, while shifts towards deeper and longer lateral wells with more complex completions have increased costs.
Costs per well generally increased from 2006 to 2012, demonstrating the effect of rapid growth in drilling activity. Since 2012, costs per well have decreased because of reduced overall drilling activity and improved drilling efficiency and tools.
U.S. production of hydrocarbon gas liquids expected to increase through 2017
U.S. production of hydrocarbon gas liquids (HGL), which includes ethane, propane, butanes and natural gasoline, is expected to increase from 3.86 million barrels per day (b/d) in 2015 to 4.33 million b/d in 2017, according to the EIA’s Short-Term Energy Outlook (STEO).
HGLs are produced at both natural gas processing plants and petroleum refineries, but natural gas plants are expected to provide more than 95 percent of the forecast production growth.
The STEO expects HGL production growth to continue outpacing natural gas production growth in 2016 and 2017, as more HGL infrastructure projects are completed.
U.K. increases oil product but new field development declines
After many years of decline, production of petroleum and other liquids in the U.K. increased by about 100,000 b/d in 2015, the EIA said. The largest contribution to this increase came from fields that were brought online in the second half of 2014. increases also came from fields that came online in 2015, and from improved performance of the U.K.’s largest producing field, the offshore Buzzard field.
A similar year-over-year increase in production volumes hasn’t occurred since 1998, when petroleum and other liquids production grew by slightly more than 100,000 b/d.
The U.K. is the second-largest liquids producer in Europe after Norway, producing one million b/d in 2015. This amount is large among European countries but small in the global market, and the U.K. remains a net importer of petroleum and other liquids.
Petroleum product exports increase in U.S.
Total U.S. petroleum product exports continued to increase in 2015, up 467,000 b/d from 2014 to 4.3 million b/d, driven by increased exports of distillate fuel, motor gasoline and propane. Mexico and countries in Central and South America continue to be major recipients of U.S. petroleum product exports.
According to the EIA, exports of distillate fuel oil represent the largest component of U.S. petroleum product exports, and averaged 1.19 million b/d in 2015, an increase of 85,000 b/d from 2014. The U.S. exported distillate fuel to 88 different countries in 2015. The country’s second-largest petroleum product in 2015 was motor gasoline. It averaged 618,000 b/d and was exported to 102 different countries, up 68,000 b/d from 2014.
Wells drilled since beginning of 2014 provide significant production
U.S. crude oil production from the Lower 48 states from new wells, including those drilled since the start of 2014, made up 48 percent of total U.S. crude oil production in 2015. That is up from 22 percent in 2007, said the EIA.
Production from new wells has grown as advances in horizontal drilling and completion techniques led to growth in oil production from low-permeability tight reservoirs. In 2015, production from tight formations accounted for more than 4 million b/d, or half of the U.S. total oil production.
U.S. oil production from tight formations increased from 0.5 million b/d in 2009 to 4.6 million b/d in May 2015, at which point decreasing oil prices contributed to declines in oil production. As of December 2015, oil production from tight formations was 8 percent lower than the level in May. More than 80 percent of oil production from tight formations originates from the Eagle Ford, Bakken, and Permian regions.


