This article looks at the rebound in the flowmeter markets in 2022 and 2023. It begins by focusing on the COVID-19 pandemic that caused a downturn in all the flowmeter markets in 2020. It then describes how the flowmeter markets recovered from the pandemic due to a combination of macroeconomic and industry-specific factors. The current recovery of the flowmeter markets is due to recovering economies in the United States and around the world, the recovery of oil prices and the oil markets, pent-up demand and supply chain issues.
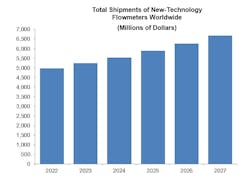
The recovery has been especially strong among new-technology flowmeters. New-technology flowmeters include Coriolis, magnetic, ultrasonic, vortex and thermal. They are contrasted with conventional flowmeters, which include differential pressure (DP), positive displacement, turbine, open channel and variable area flowmeters. DP flowmeters are often segmented between DP flow transmitters and primary elements because both are required to have a DP flowmeter. New-technology flowmeters were introduced after 1950, incorporate advanced technology, perform at a higher level than conventional meters and are more the focus of product development than older technologies.
The COVID-19 pandemic affected all of the process industries, and many others as well. This was a global phenomenon that was not limited to any specific regions. Particularly hard-hit was the oil and gas industry, and the chemical, food and beverage, power, and water and wastewater industries. Since flowmeter suppliers sell into all of these industries, the markets for all types of flowmeters declined in 2020.
In 2020, the U.S. economy went into recession in March and April. Worldwide output shrank by 4.3 percent in 2020. The recession began in most countries in February 2020. In the early months of the pandemic, tens of millions of people lost their jobs in the United States. While unemployment improved late in the year, it remained high throughout 2020. Supply chain issues arose because manufacturing plants were unable to produce needed goods, due to lack of needed materials and parts. Due to the lack of goods, prices began rising and inflation became a problem for the economy.
The economy began recovering in 2021. The gross domestic product (GDP) in the U.S. increased by 5.7 percent in 2021. Global growth rate increased by 6.02 percent in 2021. Some of this growth was due to pent-up demand. This compares to a GDP growth of 4.1 percent in the U.S. in 2019. Even though the U.S. GDP growth in 2021 was impressive, it was coming off a decline of 2.3 percent in 2020. This means that many industries did not fully recover to the 2019 level in 2021
This is the pattern followed by the worldwide flowmeter market. The flowmeter market experienced a downturn in 2020, along with the overall economy in the U.S> and many other countries. The flowmeter market has rebounded strongly since then, both in 2022 and 2023. However, some suppliers reported supply chain issues that prevented them from fulfilling some orders received in 2022 until 2023.
Oil prices and production: 2019 to December 2023
The price of crude oil is vitally important to the flowmeter industry. Drilling for oil is an expensive process involving a great deal of sophisticated equipment. In order for drillers to make a profit, prices have to be high enough to justify the time and expense of drilling for oil. The cost of drilling also varies by location. Drilling on land is typically less expensive than drilling in the ocean, and subsea drilling is one of the most expensive locations for drilling.
Two of the most common crude oils that are followed in the U.S. and Europe are West Texas Intermediate (WTI) and Brent. WTI is sourced in the United States, mainly from inland Texas, while Brent originates in Europe. The two benchmark oils run parallel in price, but in the past few years Brent has often been about $5 per barrel more expensive than WTI.
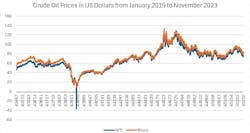
When oil prices fall below $40 per barrel, it is difficult for even the lowest cost producers to drill for oil profitably. Alternatively, with crude oil prices above $60 per barrel, drilling for oil at a profit is much more feasible. The following chart shows the prices of WTI and Brent crude oil from January 2, 2019, to November 20, 2023.
While WTI prices began 2019 below $50 per barrel, by mid-January 2019 they had climbed above $50 per barrel. Prices in April and May 2019 climbed above $60 per barrel. Oil prices remained between $50 and $60 per barrel for most of the rest of 2019. The effects of the COVID-19 pandemic began to be felt in February 2020, and oil prices began declining. On April 20, 2020, WTI actually traded in negative territory for the first time. Prices remained depressed for the rest of the year, finally climbing above $50 per barrel in early January 2021.
In 2021, oil prices were still affected by the pandemic, but were on the increase throughout the year. In 2021, prices mostly ranged between $50 and $80 per barrel. The oil market was much stronger in 2022, and prices varied between $80 and $100 per barrel for much of the year. WTI prices even climbed above $100 per barrel in March 2022, and stayed on either side of $100 per barrel through the end of July. The peak was on March 8, 2022, when WTI closed at $123.64 per barrel.
While 2023 was not as strong a year as 2022, oil prices remained north of $70 and $80 for much of the year. The effect of pent-up demand, which began in 2022, kept demand for refined petroleum products high. Despite growth in inflation and the effects of two wars, economies remained strong and stayed in recovery and growth mode throughout 2023. This period of growth in oil production has been very favorable to the flowmeter market, especially to ultrasonic, Coriolis, turbine, differential pressure and positive displacement flowmeters.
OPEC has done its part to sustain oil prices by imposing and enforcing production quotas for its members. OPEC’s main tool for controlling oil prices is to limit production through quotas on a country-by-country basis. OPEC meets periodically throughout the year to evaluate the oil markets and adjust quotas as necessary. This method has proved very effective in bringing stability to prices in the oil markets.
The 35th OPEC and non-OPEC Ministerial Meeting was held on June 4, 2023. At this meeting, crude oil production levels for OPEC and non-OPEC participating countries were adjusted starting January 1, 2024, until December 31, 2024, including Russia at 9.828 mbd based on the crude oil production level for the month of February 2023.
The 36th OPEC and non-OPEC Ministerial Meeting (ONOMM) was convened virtually on Thursday, November 30, 2023. This was also the 187th Meeting of the OPEC Conference and the 51st Meeting of the Joint Ministerial Monitoring Committee (JMMC). At this meeting, no new group cut target was announced for 2024. Instead, OPEC+ agreed to about 2.2 million barrels/day in voluntary cuts. Saudi Arabia agreed to continue its cut of one million barrels/day into
Q1 2024, while Russia agreed to a cut of 500,000 barrels/day. OPEC+ includes the members of OPEC plus Russia. At this meeting, it was announced that Brazil would join OPEC as of
January 1, 2024.
The recovery of the oil markets has been especially beneficial to the Coriolis, ultrasonic, DP and turbine markets. Over 60 percent of inline ultrasonic flowmeters are sold into the oil & gas industry, including refining. Coriolis meters are used to measure flow in upstream, midstream, and downstream segments of the oil and gas industry. Ultrasonic, turbine and DP flowmeters compete in the measurement of custody transfer of natural gas.
Flowmeter market rebound in 2022 and 2023 due to multiple factors
The flowmeter market rebounded in 2022 and 2023 for multiple reasons. The recovery of oil prices and the oil markets is a major factor. The recovery of the U.S. and world economies in 2022 is another reason why flowmeter markets recovered in 2022. Pent-up demand played a significant role in this recovery. This includes pent-up demand on the demand side and also on the supply side. The major industries that are consumers of flowmeters needed to make flowmeter purchases they had delayed during the pandemic. And flowmeter manufacturers were able to bring out products whose development was delayed in 2020 and 2021.
Supply chain issues also play a role in this market rebound. Some companies reported receiving orders in 2022 that they could not fill until 2023 due to supply chain issues. However, some supply chain issues were resolved in 2022, though some did not get resolved until 2023. Russia’s war in Ukraine has created new issues and the current instability in the Middle East only exacerbates the situation. The world sometimes is not a friendly place with many bad actors and unfortunately these bad actors sometimes have a disproportionate effect on the world economy and the economies of individual countries. Flowmeter manufacturers and consumers have to navigate this instability along with everyone else.
The future looks bright for the flowmeter markets. Many companies are now turning their attention to renewable sources of energy, including hydrogen, hydrogen storage and carbon capture, utilization, and storage (CCUS). Many companies are focusing on sustainability, which means meeting the needs of the present without compromising the ability of future generations to meet their needs. There is a gradual but undeniable view that the use of fossil fuels needs to be phased down and replaced with cleaner sources of energy. This will take many years, but flowmeters will be there to measure these changes every step of the way.
Dr. Jesse Yoder is president of Flow Research Inc., a company he founded in 1998. Dr. Yoder has 35 years of experience as a writer and as an analyst in process control and instrumentation. He has written more than 280 market research studies, most of them regarding flow and instrumentation. Dr. Yoder has also written more than 300 articles on flow and instrumentation for trade journals. Many can be found at www.flowarticles.com.
Flow Research


